

Fluorescence lifetime shifts of NAD(P)H during apoptosis measured by time-resolved flow cytometry
- PMID: 30369063
- PMCID: PMC6587805
- DOI: 10.1002/cyto.a.23606
Fluorescence lifetime shifts of NAD(P)H during apoptosis measured by time-resolved flow cytometry
Abstract
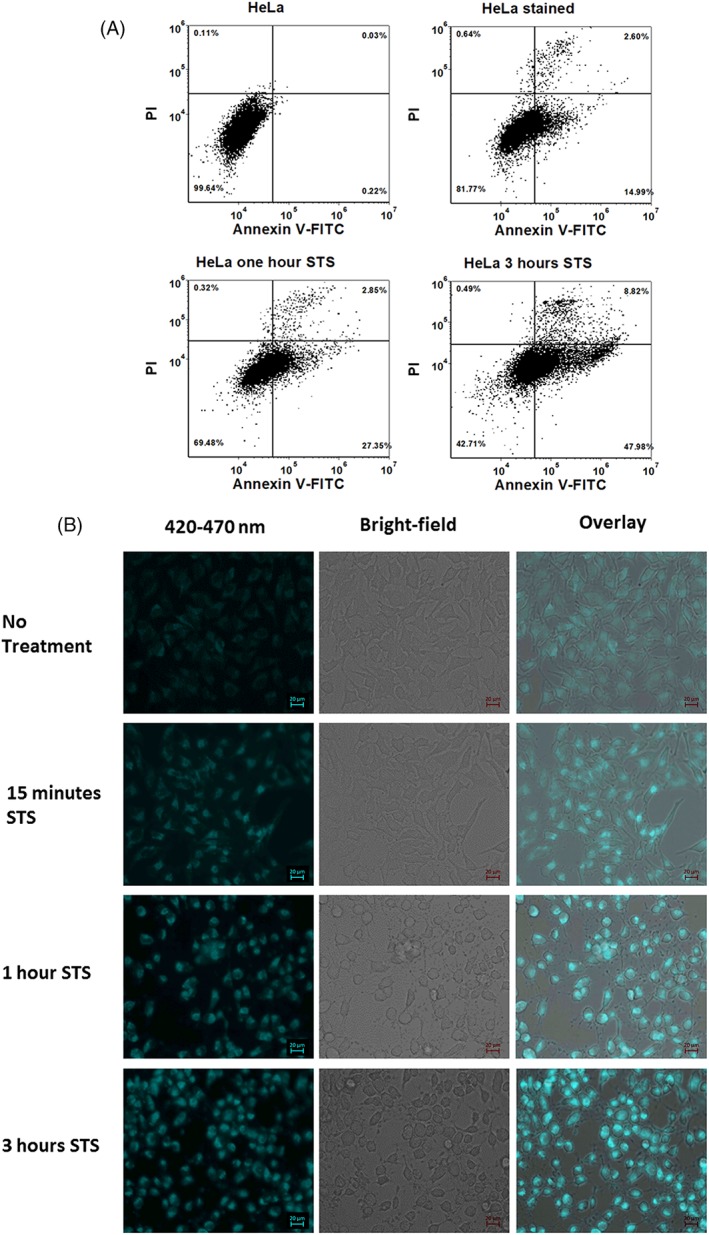
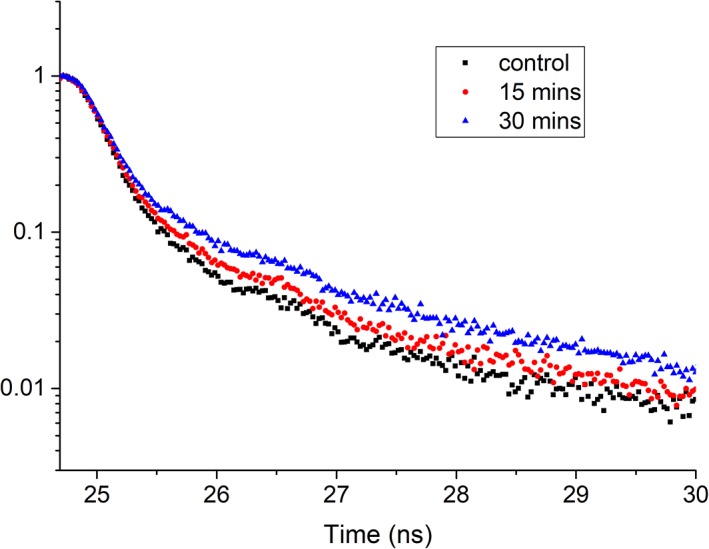
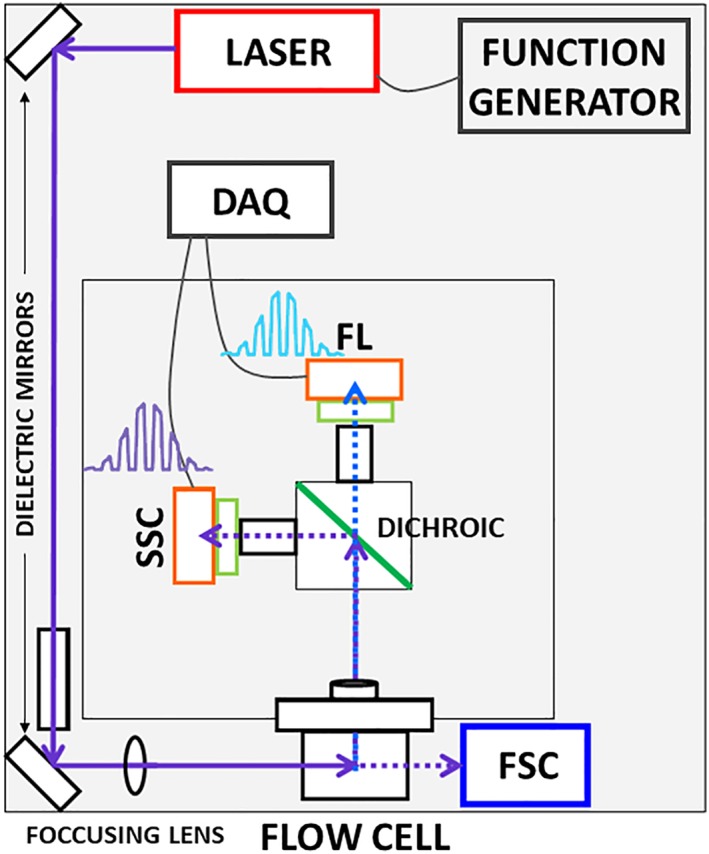
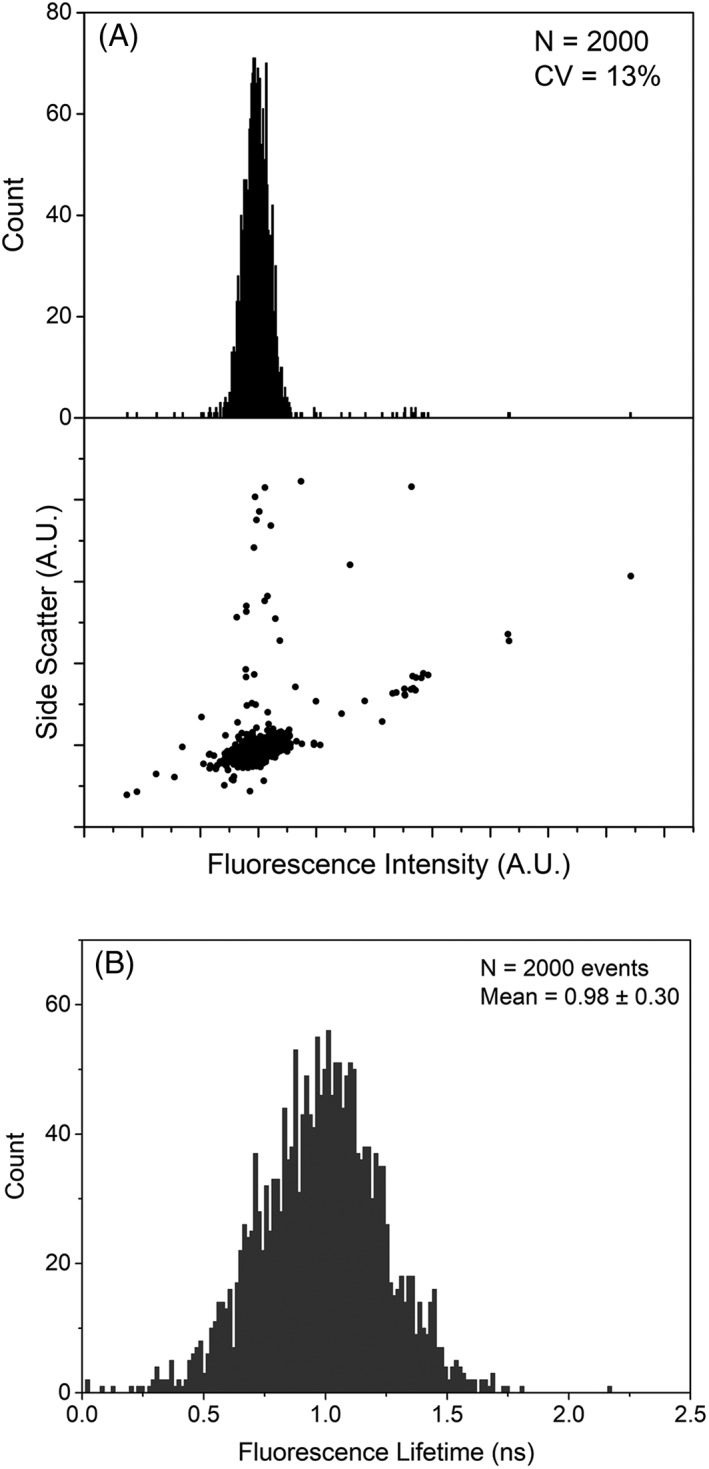
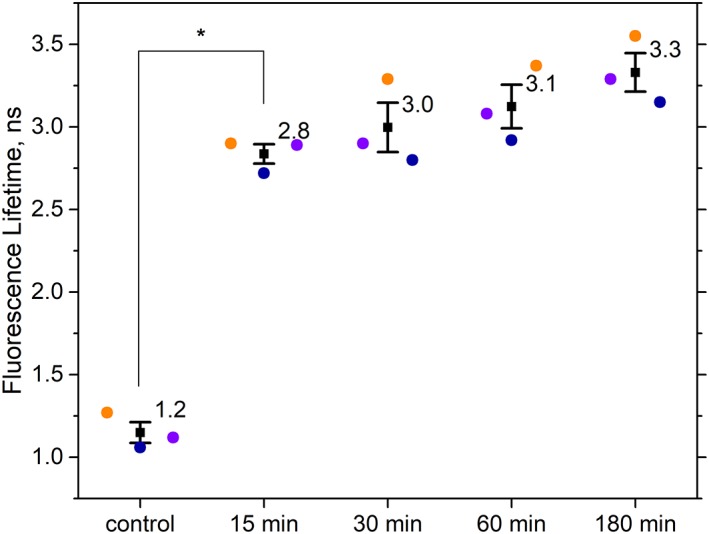
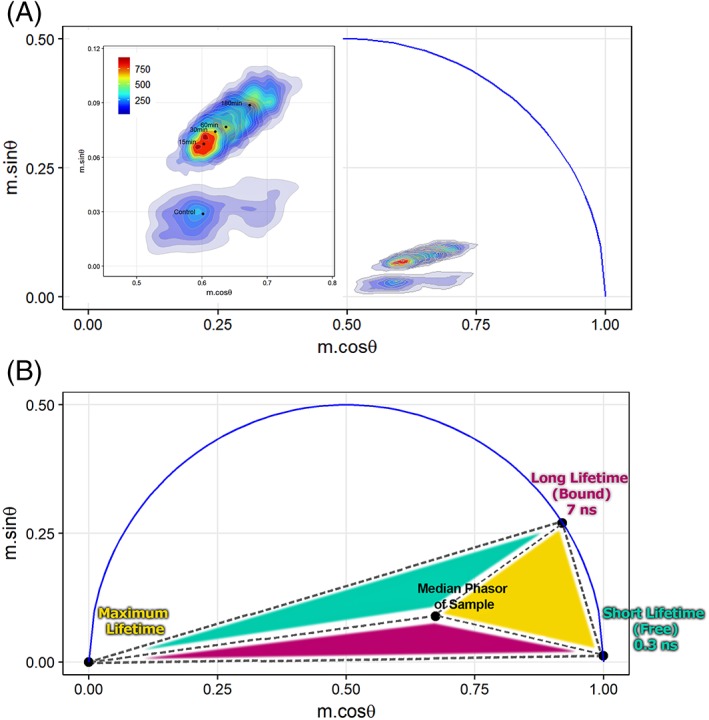
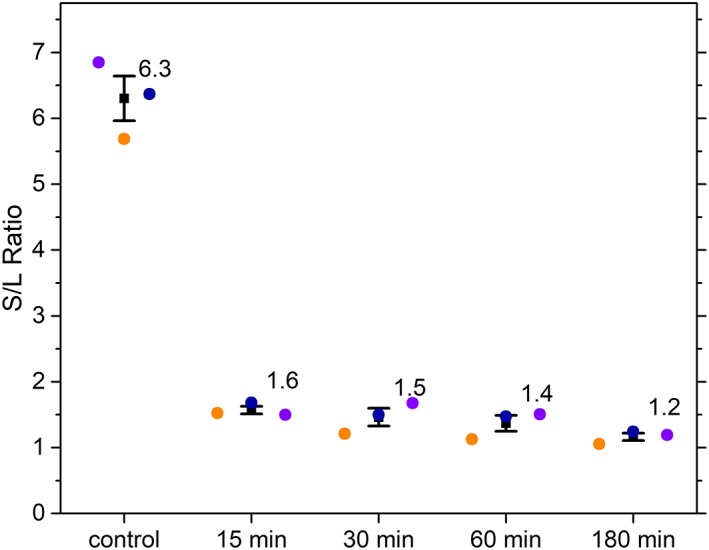
Autofluorescence from the intracellular metabolite, NAD(P)H, is a biomarker that is widely used and known to reliably screen and report metabolic activity as well as metabolic fluctuations within cells. As a ubiquitous endogenous fluorophore, NAD(P)H has a unique rate of fluorescence decay that is altered when bound to coenzymes. In this work we measure the shift in the fluorescence decay, or average fluorescence lifetime (1-3 ns), of NAD(P)H and correlate this shift to changes in metabolism that cells undergo during apoptosis. Our measurements are made with a flow cytometer designed specifically for fluorescence lifetime acquisition within the ultraviolet to violet spectrum. Our methods involved culture, treatment, and preparation of cells for cytometry and microscopy measurements. The evaluation we performed included observations and quantification of the changes in endogenous emission owing to the induction of apoptosis as well as changes in the decay kinetics of the emission measured by flow cytometry. Shifts in NAD(P)H fluorescence lifetime were observed as early as 15 min post-treatment with an apoptosis inducing agent. Results also include a phasor analysis to evaluate free to bound ratios of NAD(P)H at different time points. We defined the free to bound ratios as the ratio of 'short-to-long' (S/L) fluorescence lifetime, where S/L was found to consistently decrease with an increase in apoptosis. With a quantitative framework such as phasor analysis, the short and long lifetime components of NAD(P)H can be used to map the cycling of free and bound NAD(P)H during the early-to-late stages of apoptosis. The combination of lifetime screening and phasor analyses provides the first step in high throughput metabolic profiling of single cells and can be leveraged for screening and sorting for a range of applications in biomedicine. © 2018 The Authors. Cytometry Part A published by Wiley Periodicals, Inc. on behalf of International Society for Advancement of Cytometry.
Keywords: NAD(P)H; apoptosis; endogenous fluorescence; flow cytometry; fluorescence lifetime; label-free; metabolic mapping; metabolism; phasor.
© 2018 The Authors. Cytometry Part A published by Wiley Periodicals, Inc. on behalf of International Society for Advancement of Cytometry.
Figures
Similar articles
-
Systematic Enzyme Mapping of Cellular Metabolism by Phasor-Analyzed Label-Free NAD(P)H Fluorescence Lifetime Imaging.Int J Mol Sci. 2019 Nov 7;20(22):5565. doi: 10.3390/ijms20225565. Int J Mol Sci. 2019. PMID: 31703416 Free PMC article.
-
Evaluation of Caspase-3 Activity During Apoptosis with Fluorescence Lifetime-Based Cytometry Measurements and Phasor Analyses.Cytometry A. 2020 Dec;97(12):1265-1275. doi: 10.1002/cyto.a.24207. Epub 2020 Aug 25. Cytometry A. 2020. PMID: 32790129 Free PMC article.
-
Method to Detect the Cellular Source of Over-Activated NADPH Oxidases Using NAD(P)H Fluorescence Lifetime Imaging.Curr Protoc Cytom. 2017 Apr 3;80:9.52.1-9.52.14. doi: 10.1002/cpcy.20. Curr Protoc Cytom. 2017. PMID: 28369765
-
Overview of Fluorescence Lifetime Measurements in Flow Cytometry.Methods Mol Biol. 2018;1678:421-446. doi: 10.1007/978-1-4939-7346-0_18. Methods Mol Biol. 2018. PMID: 29071689 Review.
-
Flow cytometry: principles, applications and recent advances.Bioanalysis. 2021 Feb;13(3):181-198. doi: 10.4155/bio-2020-0267. Epub 2021 Feb 5. Bioanalysis. 2021. PMID: 33543666 Review.
Cited by
-
Guidelines for Regulated Cell Death Assays: A Systematic Summary, A Categorical Comparison, A Prospective.Front Cell Dev Biol. 2021 Mar 4;9:634690. doi: 10.3389/fcell.2021.634690. eCollection 2021. Front Cell Dev Biol. 2021. PMID: 33748119 Free PMC article. Review.
-
Systematic Enzyme Mapping of Cellular Metabolism by Phasor-Analyzed Label-Free NAD(P)H Fluorescence Lifetime Imaging.Int J Mol Sci. 2019 Nov 7;20(22):5565. doi: 10.3390/ijms20225565. Int J Mol Sci. 2019. PMID: 31703416 Free PMC article.
-
Detecting Förster resonance energy transfer in living cells by conventional and spectral flow cytometry.Cytometry A. 2022 Oct;101(10):818-834. doi: 10.1002/cyto.a.24472. Epub 2021 Jun 24. Cytometry A. 2022. PMID: 34128311 Free PMC article.
-
Time-domain single photon-excited autofluorescence lifetime for label-free detection of T cell activation.Opt Lett. 2021 May 1;46(9):2168-2171. doi: 10.1364/OL.422445. Opt Lett. 2021. PMID: 33929445 Free PMC article.
-
Toward the Development of an On-Chip Acoustic Focusing Fluorescence Lifetime Flow Cytometer.Front Phys. 2021 May;9:647985. doi: 10.3389/fphy.2021.647985. Epub 2021 May 14. Front Phys. 2021. PMID: 34386487 Free PMC article.
References
-
- Miranda‐Lorenzo I, Dorado J, Lonardo E, Alcala S, Serrano AG, Clausell‐Tormos J, Cioffi M, Megias D, Zagorac S, Balic A. Intracellular autofluorescence: a biomarker for epithelial cancer stem cells. Nat Methods 2014;11:1161–1169. - PubMed
Publication types
MeSH terms
Substances
Grants and funding
LinkOut - more resources
Full Text Sources
Other Literature Sources
Research Materials
Miscellaneous
