

Exercise-induced mitochondrial biogenesis coincides with the expression of mitochondrial translation factors in murine skeletal muscle
- PMID: 30369085
- PMCID: PMC6204255
- DOI: 10.14814/phy2.13893
Exercise-induced mitochondrial biogenesis coincides with the expression of mitochondrial translation factors in murine skeletal muscle
Abstract
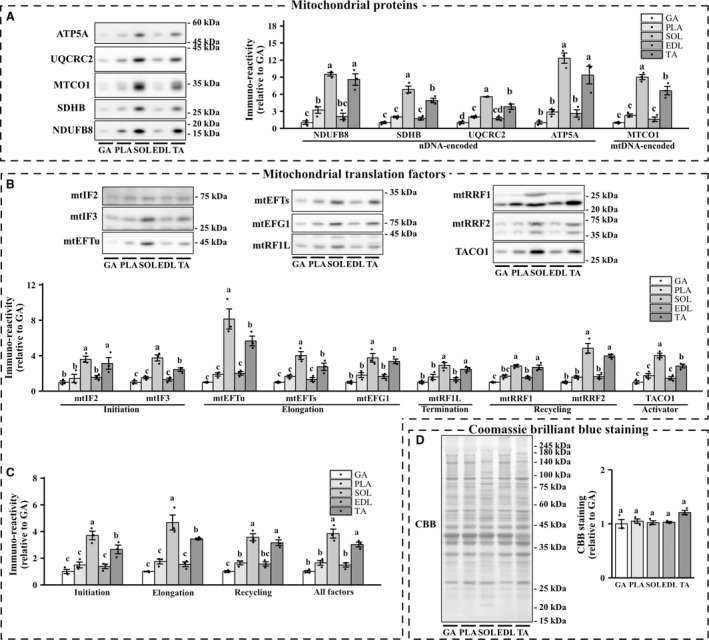
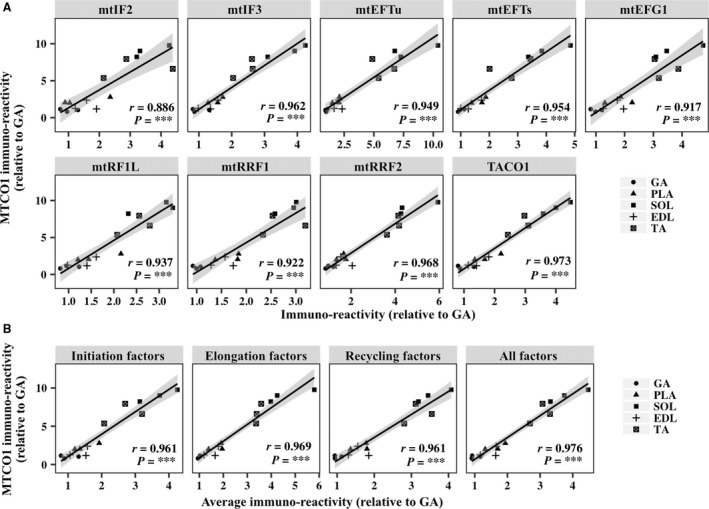
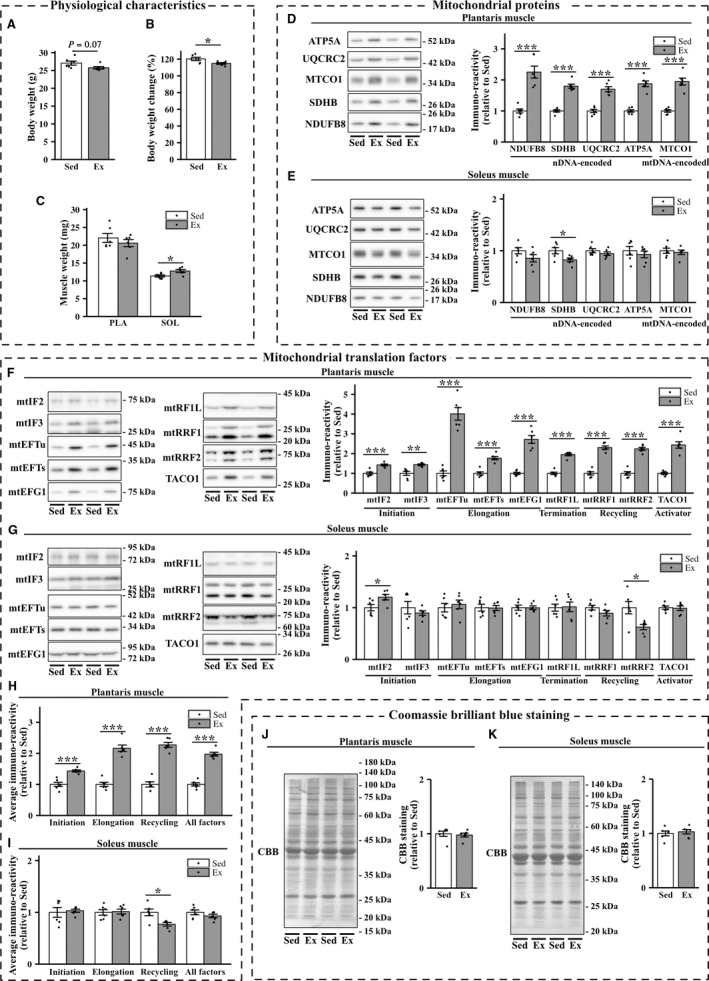
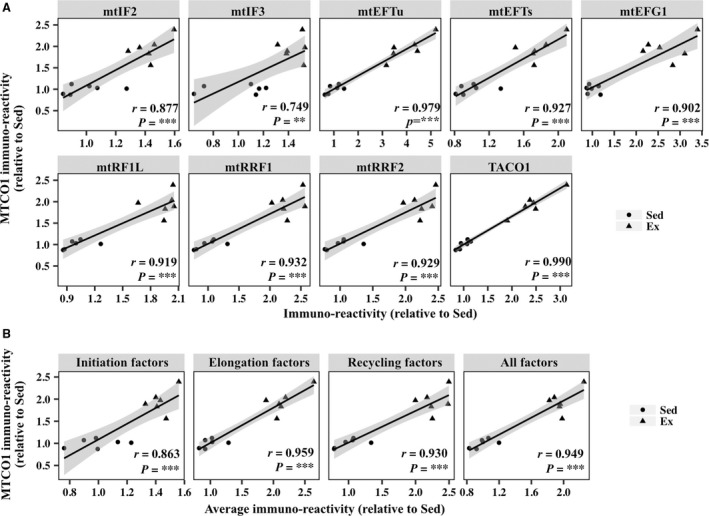
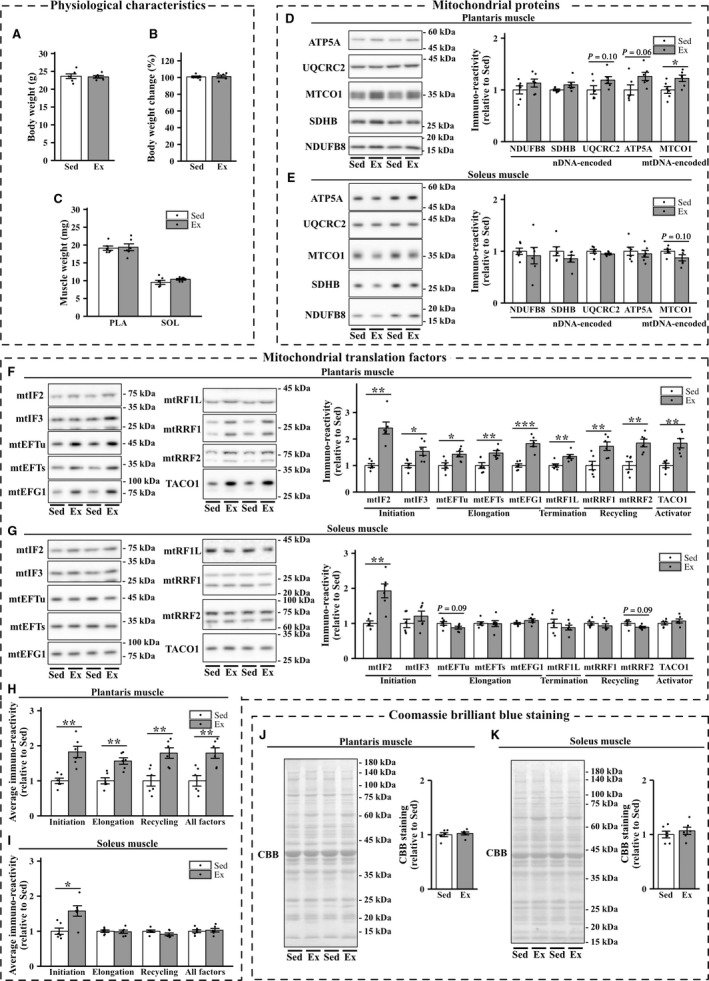
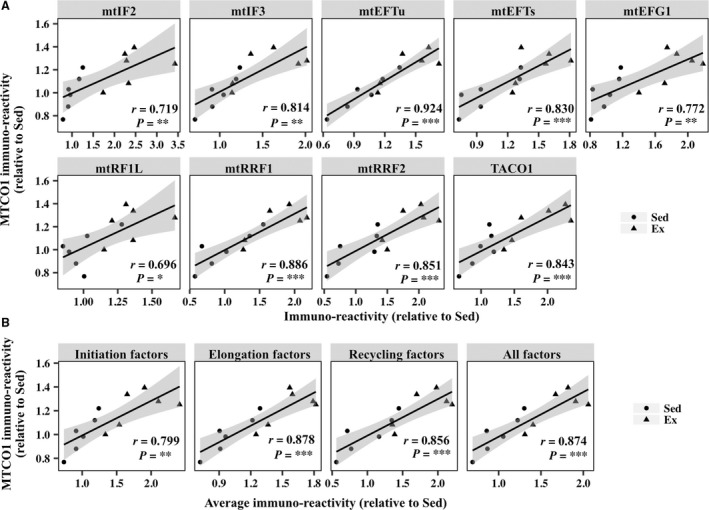
The process of mitochondrial translation, in which mitochondrial (mt)DNA-encoded genes are translated into proteins, is crucial for mitochondrial function and biogenesis. In each phase, a series of mitochondrial translation factors is required for the synthesis of mtDNA-encoded mitochondrial proteins. Two mitochondrial initiation factors (mtIF2 and mtIF3), three mitochondrial elongation factors (mtEFTu, mtEFTs, and mtEFG1), one mitochondrial release factor (mtRF1L), and two mitochondrial recycling factors (mtRRF1 and mtRRF2) are mitochondrial translation factors that coordinate each translational phase. Exercise increases both nuclear DNA- and mtDNA-encoded mitochondrial proteins, resulting in mitochondrial biogenesis in skeletal muscles. Therefore, mitochondrial translation factors are likely regulated by exercise; however, it is unclear whether exercise affects mitochondrial translation factors in the skeletal muscles. We investigated whether exercise training comprehensively increases this series of mitochondrial translation factors, as well as mtDNA-encoded proteins, in the skeletal muscle. Mice were randomly assigned to either the sedentary or exercise group and housed in standard cages with or without a running wheel for 1 and 8 weeks. The expression levels of mitochondrial translation factors in the plantaris and soleus muscles were then measured. Exercise training concomitantly upregulated mitochondrial translation factors and mitochondrial proteins in the plantaris muscle. However, in the soleus muscle, these comprehensive upregulations were not detected. These results indicate that exercise-induced mitochondrial biogenesis coincides with the upregulation of mitochondrial translation factors.
Keywords: Mitochondrial translation factor; exercise; mitochondrial biogenesis; skeletal muscle.
© 2018 The Authors. Physiological Reports published by Wiley Periodicals, Inc. on behalf of The Physiological Society and the American Physiological Society.
Figures
Similar articles
-
Muscle denervation reduces mitochondrial biogenesis and mitochondrial translation factor expression in mice.Biochem Biophys Res Commun. 2020 Jun 18;527(1):146-152. doi: 10.1016/j.bbrc.2020.04.062. Epub 2020 Apr 28. Biochem Biophys Res Commun. 2020. PMID: 32446358
-
Exercise training increases CISD family protein expression in murine skeletal muscle and white adipose tissue.Biochem Biophys Res Commun. 2018 Nov 30;506(3):571-577. doi: 10.1016/j.bbrc.2018.10.101. Epub 2018 Oct 23. Biochem Biophys Res Commun. 2018. PMID: 30366664
-
Nuclear factor erythroid-derived 2-like 2 (NFE2L2, Nrf2) mediates exercise-induced mitochondrial biogenesis and the anti-oxidant response in mice.J Physiol. 2016 Sep 15;594(18):5195-207. doi: 10.1113/JP271957. Epub 2016 May 27. J Physiol. 2016. PMID: 27094017 Free PMC article.
-
Mechanisms of exercise-induced mitochondrial biogenesis in skeletal muscle: implications for health and disease.Compr Physiol. 2011 Jul;1(3):1119-34. doi: 10.1002/cphy.c100074. Compr Physiol. 2011. PMID: 23733637 Review.
-
Transcription Factor Movement and Exercise-Induced Mitochondrial Biogenesis in Human Skeletal Muscle: Current Knowledge and Future Perspectives.Int J Mol Sci. 2022 Jan 28;23(3):1517. doi: 10.3390/ijms23031517. Int J Mol Sci. 2022. PMID: 35163441 Free PMC article. Review.
Cited by
-
The role of SIRT3 in homeostasis and cellular health.Front Cell Neurosci. 2024 Aug 2;18:1434459. doi: 10.3389/fncel.2024.1434459. eCollection 2024. Front Cell Neurosci. 2024. PMID: 39157755 Free PMC article. Review.
-
Muscle-Specific Sensitivity to Voluntary Physical Activity and Detraining.Front Physiol. 2019 Oct 23;10:1328. doi: 10.3389/fphys.2019.01328. eCollection 2019. Front Physiol. 2019. PMID: 31708796 Free PMC article.
-
Mitochondrial Protein Translation: Emerging Roles and Clinical Significance in Disease.Front Cell Dev Biol. 2021 Jul 1;9:675465. doi: 10.3389/fcell.2021.675465. eCollection 2021. Front Cell Dev Biol. 2021. PMID: 34277617 Free PMC article. Review.
-
Caffeine increases myoglobin expression via the cyclic AMP pathway in L6 myotubes.Physiol Rep. 2021 May;9(9):e14869. doi: 10.14814/phy2.14869. Physiol Rep. 2021. PMID: 33991466 Free PMC article.
-
PEDF-Mediated Mitophagy Triggers the Visual Cycle by Enhancing Mitochondrial Functions in a H2O2-Injured Rat Model.Cells. 2021 May 6;10(5):1117. doi: 10.3390/cells10051117. Cells. 2021. PMID: 34066394 Free PMC article.
References
-
- Anderson, S. , Bankier A. T., Barrell B. G., de Bruijn M. H., Coulson A. R., Drouin J., et al. 1981. Sequence and organization of the human mitochondrial genome. Nature 290:457–465. - PubMed
-
- Baker, B. M. , and Haynes C. M.. 2011. Mitochondrial protein quality control during biogenesis and aging. Trends Biochem. Sci. 36:254–261. - PubMed
-
- Benton, C. R. , Nickerson J. G., Lally J., Han X.‐X., Holloway G. P., Glatz J. F. C., et al. 2008. Modest PGC‐1α overexpression in muscle in vivo is sufficient to increase insulin sensitivity and palmitate oxidation in subsarcolemmal, not intermyofibrillar, mitochondria. J. Biol. Chem. 283:4228–4240. - PubMed
