

Predictors of early mortality and readmissions among dialysis patients undergoing lower extremity amputation
- PMID: 30369411
- PMCID: PMC6211198
- DOI: 10.1016/j.jvs.2018.03.408
Predictors of early mortality and readmissions among dialysis patients undergoing lower extremity amputation
Abstract
Objective: Patients receiving dialysis are at increased risk for lower extremity amputations (LEAs) and postoperative morbidity. Limited studies have examined differences in 30-day outcomes of mortality and health care use after amputation or the preoperative factors that relate to worsened outcomes in dialysis patients. Our objective was to examine dialysis dependency and other preoperative factors associated with readmission or death after LEA.
Methods: A retrospective cohort study was conducted of dialysis-dependent and nondialysis patients undergoing major LEA in the 2012 to 2013 American College of Surgeons National Surgical Quality Improvement Program. Primary outcomes included death and hospital readmission within 30 days of amputation.
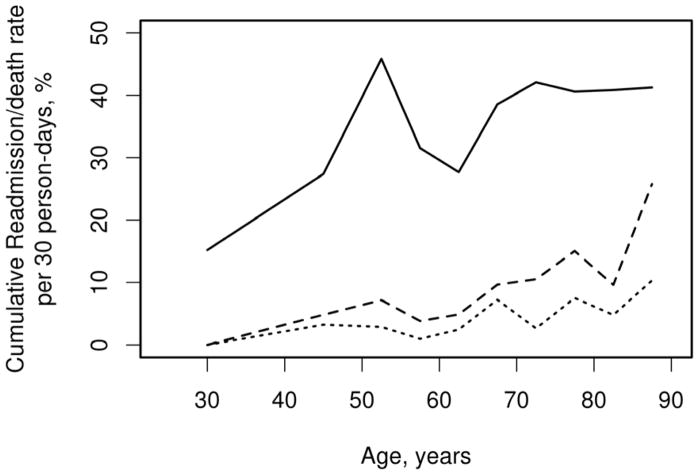
Results: Of 6468 patients, 1166 (18%) were dialysis dependent. The dialysis cohort had more blacks (39% vs 23%), diabetes (76% vs 58%), below-knee amputations (62% vs 55%), and in-hospital deaths (8% vs 3%; all P < .001). The 30-day postoperative death rates (15% vs 7%) and readmission rates (35% vs 20% per 30 person-days; both P < .001) were higher in dialysis patients. Among the live discharges, the rate of any readmission or death within 30 days from amputation was highest in those aged ≥50 years (40% per 30 person-days). Multivariable analyses in the dialysis cohort revealed increased age, above-knee amputation, decreased physical status, heart failure, high preoperative white blood cell count, and low platelet count to be associated with death (P < .05; C statistic, 0.75). The only preoperative factor associated with readmission in dialysis patients was race (P = .04; C statistic, 0.58).
Conclusions: Readmission or death after amputation is increased among dialysis patients. Predicting which dialysis patients are at highest risk for death is feasible, whereas predicting which will require readmission is less so. Risk factor identification may improve risk stratification, inform reimbursement policies, and allow targeted interventions to improve outcomes.
Keywords: Age; Cardiovascular disease; Diabetes; Hemodialysis; Hospitalization; Survival analysis.
Copyright © 2018 Society for Vascular Surgery. Published by Elsevier Inc. All rights reserved.
Conflict of interest statement
The authors have no financial disclosures.
The results presented in this paper have not been published previously in whole or part, except in abstract format.
Figures


Similar articles
-
Risk factors and indications for readmission after lower extremity amputation in the American College of Surgeons National Surgical Quality Improvement Program.J Vasc Surg. 2014 Nov;60(5):1315-1324. doi: 10.1016/j.jvs.2014.05.050. Epub 2014 Jun 28. J Vasc Surg. 2014. PMID: 24985536 Free PMC article.
-
Survival after major lower extremity amputation in patients with end-stage renal disease.J Vasc Surg. 2019 Oct;70(4):1291-1298. doi: 10.1016/j.jvs.2018.12.055. J Vasc Surg. 2019. PMID: 31543169
-
Perioperative Outcomes after Regional Versus General Anesthesia for Above the Knee Amputations.Ann Vasc Surg. 2018 Apr;48:53-66. doi: 10.1016/j.avsg.2017.10.014. Epub 2017 Dec 5. Ann Vasc Surg. 2018. PMID: 29217448
-
Lower extremity amputation in peripheral artery disease: improving patient outcomes.Vasc Health Risk Manag. 2014 Jul 16;10:417-24. doi: 10.2147/VHRM.S50588. eCollection 2014. Vasc Health Risk Manag. 2014. PMID: 25075192 Free PMC article. Review.
-
Current Predictors of Mortality in Veteran Patients Undergoing Major Lower Extremity Amputations: Risk Factors Have Not Changed and Mortality Remains High.Am Surg. 2023 May;89(5):1725-1735. doi: 10.1177/00031348221074235. Epub 2022 Feb 7. Am Surg. 2023. PMID: 35124982 Review.
Cited by
-
Risks and Risk Factors for Ipsilateral Re-Amputation in the First Year Following First Major Unilateral Dysvascular Amputation.Eur J Vasc Endovasc Surg. 2020 Oct;60(4):614-621. doi: 10.1016/j.ejvs.2020.06.026. Epub 2020 Aug 13. Eur J Vasc Endovasc Surg. 2020. PMID: 32800475 Free PMC article.
-
Outcomes and risk factors for complications, readmissions, and reoperations following below-knee amputation: a comprehensive analysis beyond the 30-day window.Eur J Orthop Surg Traumatol. 2025 Jul 3;35(1):289. doi: 10.1007/s00590-025-04409-y. Eur J Orthop Surg Traumatol. 2025. PMID: 40608127
-
Benefits of an Enhanced Recovery Pathway for Lower Extremity Amputation Patients.Ann Vasc Surg. 2025 Oct;119:99-110. doi: 10.1016/j.avsg.2025.04.125. Epub 2025 May 2. Ann Vasc Surg. 2025. PMID: 40320210
-
A predictive score for 30-day survival for patients undergoing major lower limb amputation for peripheral arterial obstructive disease.Updates Surg. 2021 Oct;73(5):1989-2000. doi: 10.1007/s13304-021-01085-5. Epub 2021 Jun 13. Updates Surg. 2021. PMID: 34120323 Free PMC article.
-
Risk Factors for Lower Extremity Amputation in Patients with End-Stage Kidney Disease: A Nationwide Cohort Study.J Clin Med. 2023 Aug 30;12(17):5641. doi: 10.3390/jcm12175641. J Clin Med. 2023. PMID: 37685708 Free PMC article.
References
-
- Moxey PW, Gogalniceanu P, Hinchliffe RJ, Loftus IM, Jones KJ, Thompson MM, et al. Lower extremity amputations--a review of global variability in incidence. Diabet Med. 2011;28(10):1144–1153. - PubMed
-
- Healthy People 2020. Diabetes Objective D-5. Healthy People 2020; 2014. https://www.healthypeople.gov/2020/topics-objectives/topic/diabetes/obje....
-
- Gregg EW, Li Y, Wang J, Burrows NR, Ali MK, Rolka D, et al. Changes in diabetes-related complications in the United States, 1990–2010. N Engl J Med. 2014;370(16):1514–1523. - PubMed
-
- Jencks SF, Williams MV, Coleman EA. Rehospitalizations among patients in the Medicare fee-for-service program. N Engl J Med. 2009;360(14):1418–1428. - PubMed
-
- Weiss AJ, Elixhauser A, Steiner C. Healthcare Cost and Utilization Project (HCUP) Statistical Briefs. Rockville (MD): 2013. Readmissions to U.S. Hospitals by Procedure, 2010: Statistical Brief #154. - PubMed
Publication types
MeSH terms
Grants and funding
LinkOut - more resources
Full Text Sources
Medical
