

Weighted Gene Co-expression Network Analysis of Endometriosis and Identification of Functional Modules Associated With Its Main Hallmarks
- PMID: 30369943
- PMCID: PMC6194152
- DOI: 10.3389/fgene.2018.00453
Weighted Gene Co-expression Network Analysis of Endometriosis and Identification of Functional Modules Associated With Its Main Hallmarks
Abstract
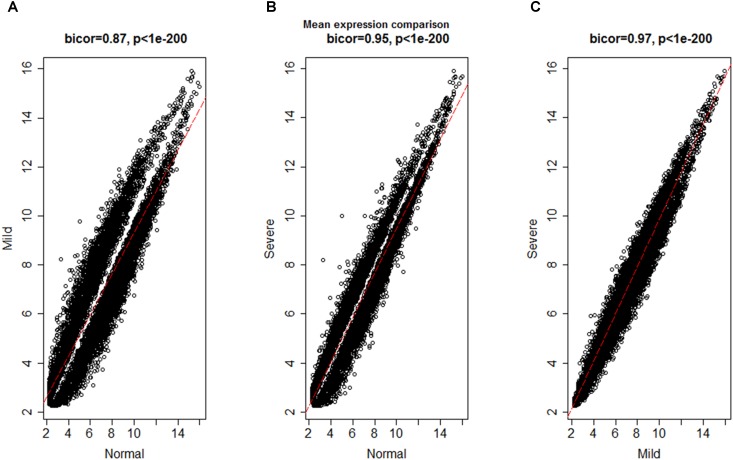
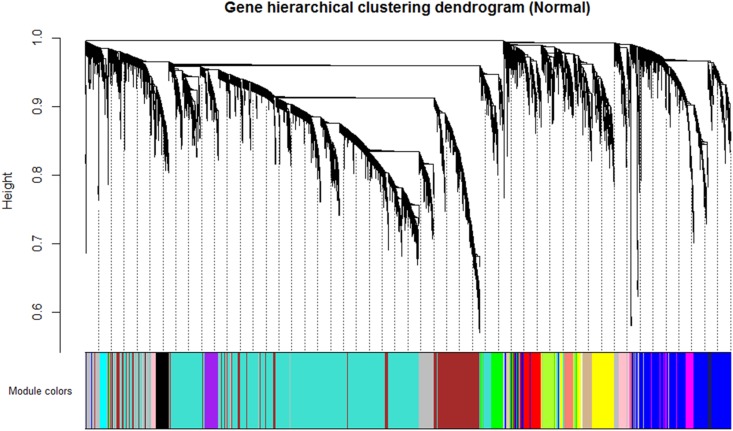
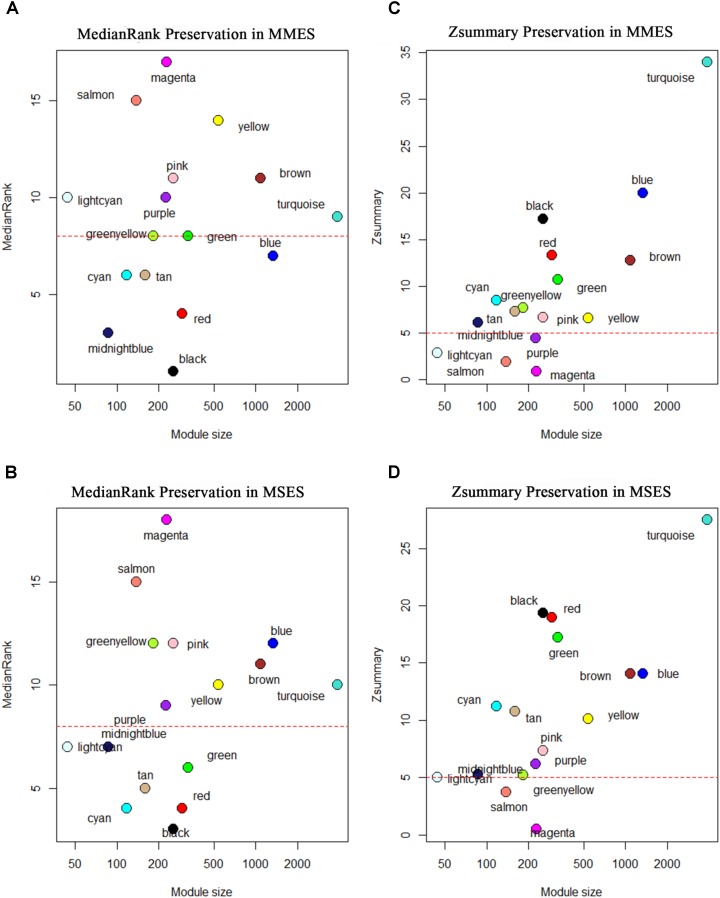
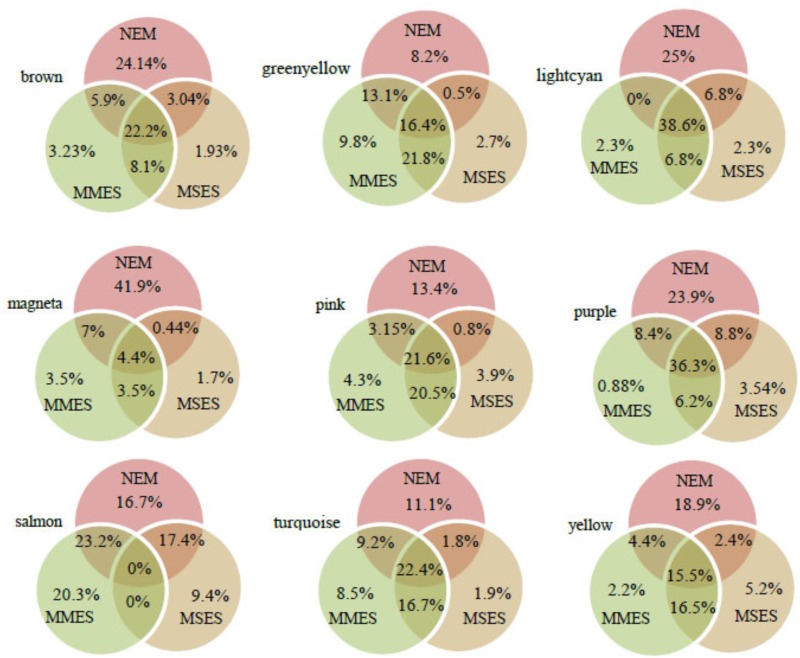
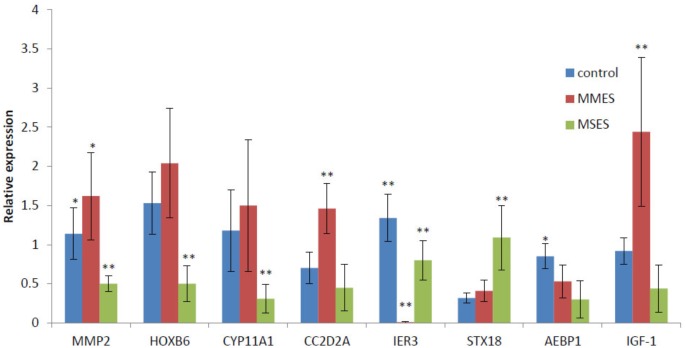
Although many genes have been identified using high throughput technologies in endometriosis (ES), only a small number of individual genes have been analyzed functionally. This is due to the complexity of the disease that has different stages and is affected by various genetic and environmental factors. Many genes are upregulated or downregulated at each stage of the disease, thus making it difficult to identify key genes. In addition, little is known about the differences between the different stages of the disease. We assumed that the study of the identified genes in ES at a system-level can help to better understand the molecular mechanism of the disease at different stages of the development. We used publicly available microarray data containing archived endometrial samples from women with minimal/mild endometriosis (MMES), mild/severe endometriosis (MSES) and without endometriosis. Using weighted gene co-expression analysis (WGCNA), functional modules were derived from normal endometrium (NEM) as the reference sample. Subsequently, we tested whether the topology or connectivity pattern of the modules was preserved in MMES and/or MSES. Common and specific hub genes were identified in non-preserved modules. Accordingly, hub genes were detected in the non-preserved modules at each stage. We identified sixteen co-expression modules. Of the 16 modules, nine were non-preserved in both MMES and MSES whereas five were preserved in NEM, MMES, and MSES. Importantly, two non-preserved modules were found in either MMES or MSES, highlighting differences between the two stages of the disease. Analyzing the hub genes in the non-preserved modules showed that they mostly lost or gained their centrality in NEM after developing the disease into MMES and MSES. The same scenario was observed, when the severeness of the disease switched from MMES to MSES. Interestingly, the expression analysis of the new selected gene candidates including CC2D2A, AEBP1, HOXB6, IER3, and STX18 as well as IGF-1, CYP11A1 and MMP-2 could validate such shifts between different stages. The overrepresented gene ontology (GO) terms were enriched in specific modules, such as genetic disposition, estrogen dependence, progesterone resistance and inflammation, which are known as endometriosis hallmarks. Some modules uncovered novel co-expressed gene clusters that were not previously discovered.
Keywords: endometriosis; expression; hub genes; module; weighted gene co-expression network.
Figures

References
-
- Attar E., Tokunaga H., Imir G., Yilmaz M. B., Redwine D., Putman M., et al. (2009). Prostaglandin E2 via steroidogenic factor-1 coordinately regulates transcription of steroidogenic genes necessary for estrogen synthesis in endometriosis. J. Clin. Endocrinol. Metab. 94 623–631. 10.1210/jc.2008-1180 - DOI - PMC - PubMed
-
- Attia G. R., Zeitoun K., Edwards D., Johns A., Carr B. R., Bulun S. E. (2000). Progesterone receptor isoform A But Not B is expressed in endometriosis 1. J. Clin. Endocrinol. Metab. 85 2897–2902. - PubMed
LinkOut - more resources
Full Text Sources
Miscellaneous