

Heart-Lung interaction in spontaneous breathing subjects: the basics
- PMID: 30370275
- PMCID: PMC6186567
- DOI: 10.21037/atm.2018.06.19
Heart-Lung interaction in spontaneous breathing subjects: the basics
Abstract
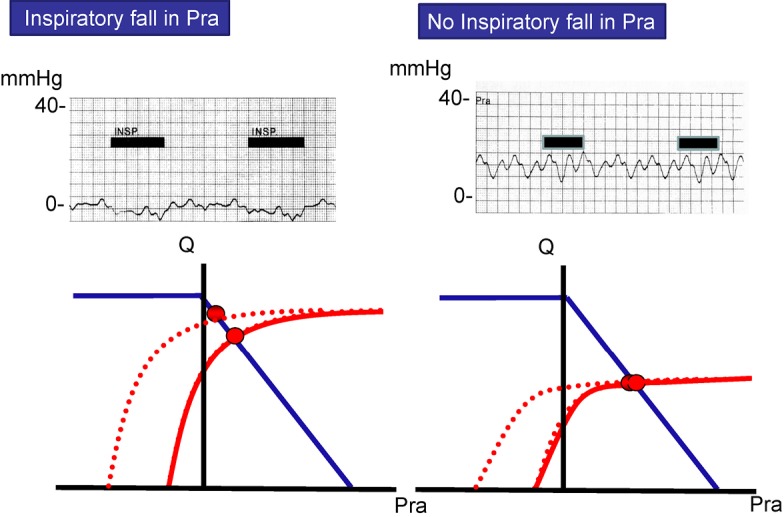
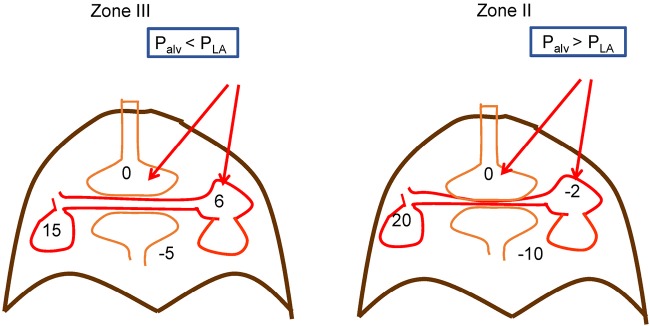
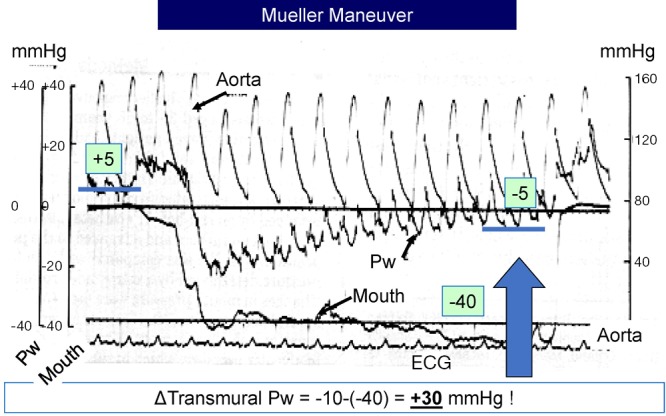
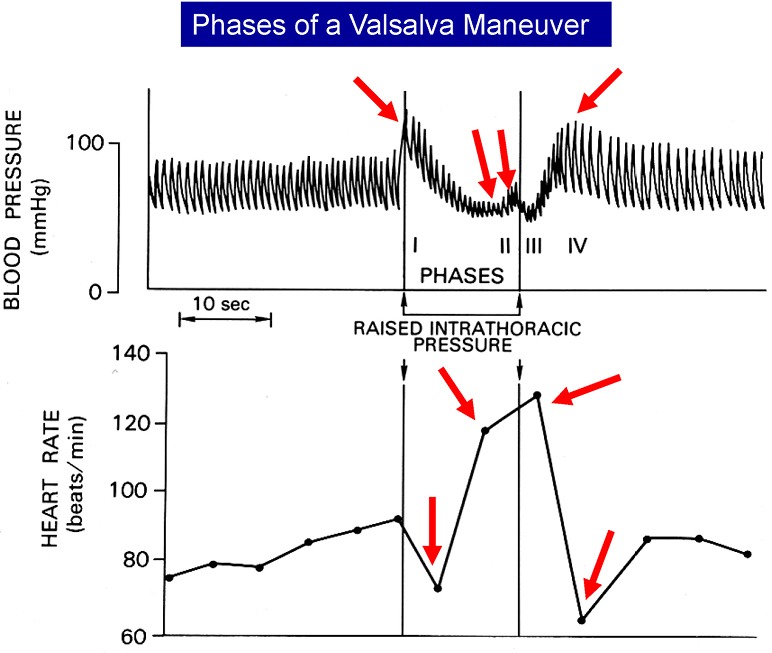
Heart-lung interactions occur primarily because of two components of lung inflation, changes in pleural pressure and changes in transpulmonary pressure. Of these, changes in pleural pressure dominate during spontaneous breathing. Because the heart is surrounded by pleural pressure, during inspiration the environment of the heart falls relative to the rest of the body. This alters inflow into the right heart and outflow from the left heart. Alterations in transpulmonary pressure can alter the outflow from the right heart and the inflow to the left heart. These interactions are modified by the cardiac and respiratory frequency, ventricular function and magnitude of the respiratory efforts.
Keywords: Pleural pressure; cardiac function; transpulmonary pressure; venous return.
Conflict of interest statement
Conflicts of Interest: The author has no conflicts of interest to declare.
Figures


Similar articles
-
Understanding cardiopulmonary interactions through esophageal pressure monitoring.Front Physiol. 2023 Jul 19;14:1221829. doi: 10.3389/fphys.2023.1221829. eCollection 2023. Front Physiol. 2023. PMID: 37538376 Free PMC article. Review.
-
Heart-lung interactions during mechanical ventilation: the basics.Ann Transl Med. 2018 Sep;6(18):349. doi: 10.21037/atm.2018.04.29. Ann Transl Med. 2018. PMID: 30370276 Free PMC article. Review.
-
Cardiovascular disturbances in chronic respiratory insufficiency.Am J Cardiol. 1981 Apr;47(4):941-9. doi: 10.1016/0002-9149(81)90197-1. Am J Cardiol. 1981. PMID: 7010978 Review.
-
Mechanical effects of inspiration on heart functions: a review.Fed Proc. 1981 Jun;40(8):2172-7. Fed Proc. 1981. PMID: 7238901
-
Volume-controlled Ventilation Does Not Prevent Injurious Inflation during Spontaneous Effort.Am J Respir Crit Care Med. 2017 Sep 1;196(5):590-601. doi: 10.1164/rccm.201610-1972OC. Am J Respir Crit Care Med. 2017. PMID: 28212050
Cited by
-
Respiratory variations in pulse pressure and photoplethysmographic waveform amplitude during positive expiratory pressure and continuous positive airway pressure in a model of progressive hypovolemia.PLoS One. 2019 Sep 27;14(9):e0223071. doi: 10.1371/journal.pone.0223071. eCollection 2019. PLoS One. 2019. PMID: 31560715 Free PMC article. Clinical Trial.
-
Fluid management strategies and their interaction with mechanical ventilation: from experimental studies to clinical practice.Intensive Care Med Exp. 2023 Jul 21;11(1):44. doi: 10.1186/s40635-023-00526-2. Intensive Care Med Exp. 2023. PMID: 37474816 Free PMC article. Review.
-
Computational framework for the generation of one-dimensional vascular models accounting for uncertainty in networks extracted from medical images.ArXiv [Preprint]. 2024 May 9:arXiv:2309.08779v3. ArXiv. 2024. Update in: J Physiol. 2024 Aug;602(16):3929-3954. doi: 10.1113/JP286193. PMID: 38313199 Free PMC article. Updated. Preprint.
-
Understanding cardiopulmonary interactions through esophageal pressure monitoring.Front Physiol. 2023 Jul 19;14:1221829. doi: 10.3389/fphys.2023.1221829. eCollection 2023. Front Physiol. 2023. PMID: 37538376 Free PMC article. Review.
-
Comparison of cardiac volumetry using real-time MRI during free-breathing with standard cine MRI during breath-hold in children.Pediatr Radiol. 2022 Jul;52(8):1462-1475. doi: 10.1007/s00247-022-05327-5. Epub 2022 Mar 30. Pediatr Radiol. 2022. PMID: 35353211 Free PMC article.
References
-
- Magder S. Mechanical interactions between the respiratory and circulatory systems. In: Bradley TD, Floras JS. editors. Sleep Apnea: implications in cardiovascular and cerebrovascular disease. Lung Biology in Health and Disease. New York: Informa Health Care USA, Inc., 2010:40-60.
Publication types
LinkOut - more resources
Full Text Sources