

Potential regulatory network in the PSG10P/miR-19a-3p/IL1RAP pathway is possibly involved in preeclampsia pathogenesis
- PMID: 30370628
- PMCID: PMC6349174
- DOI: 10.1111/jcmm.13985
Potential regulatory network in the PSG10P/miR-19a-3p/IL1RAP pathway is possibly involved in preeclampsia pathogenesis
Abstract
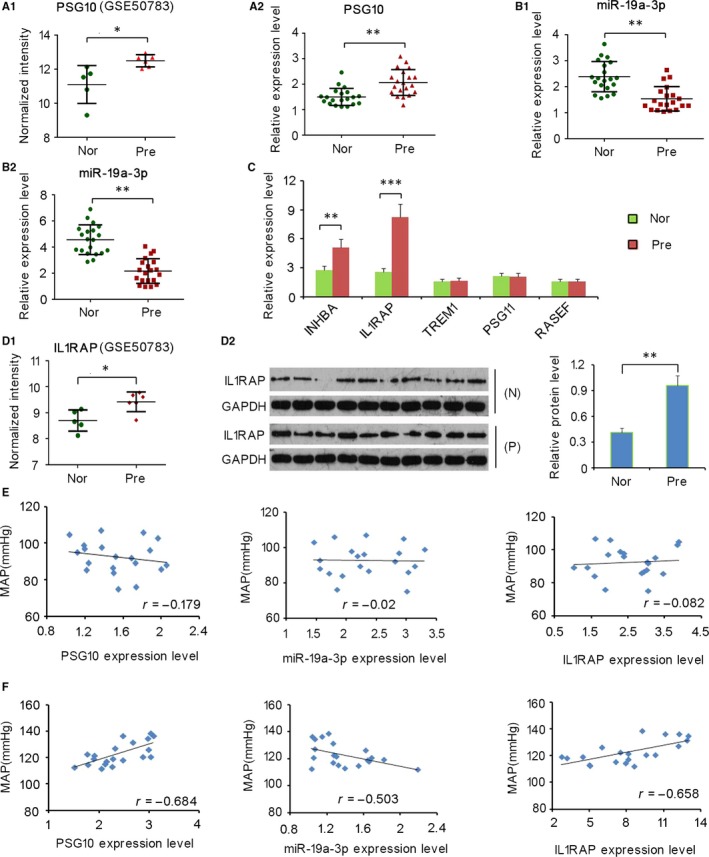
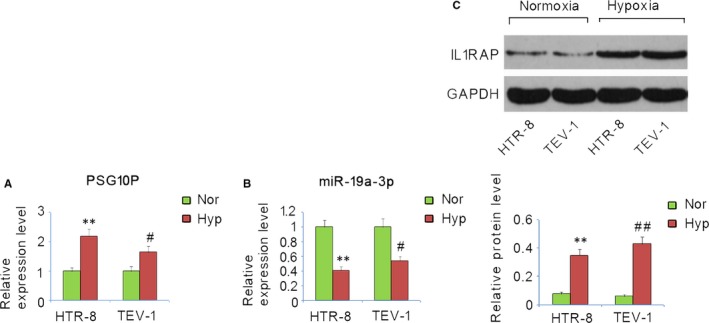
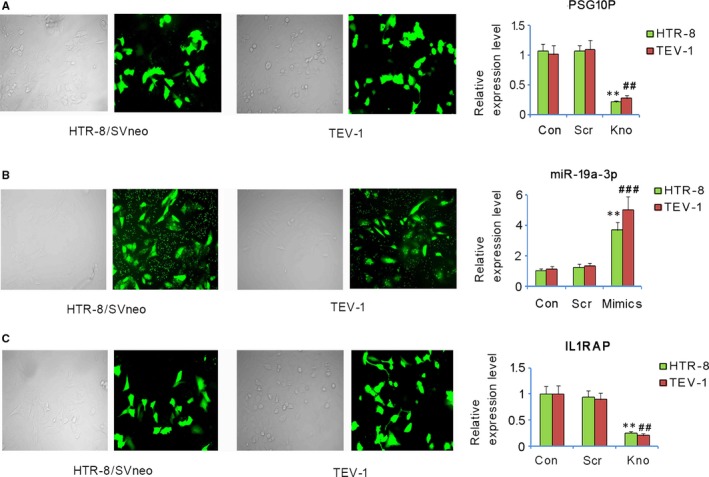
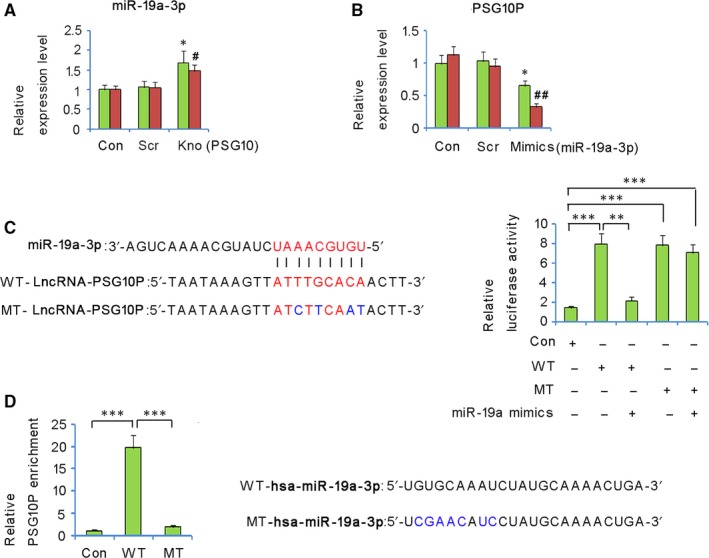
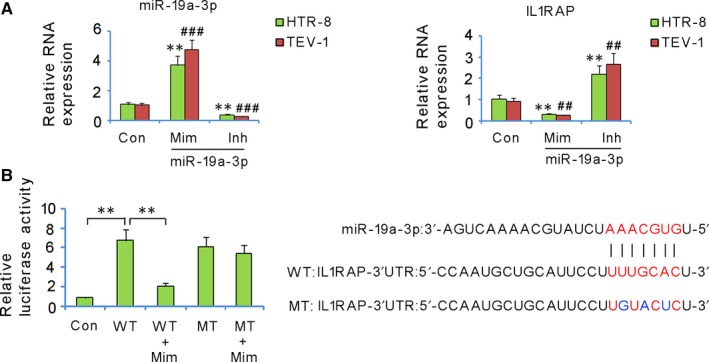
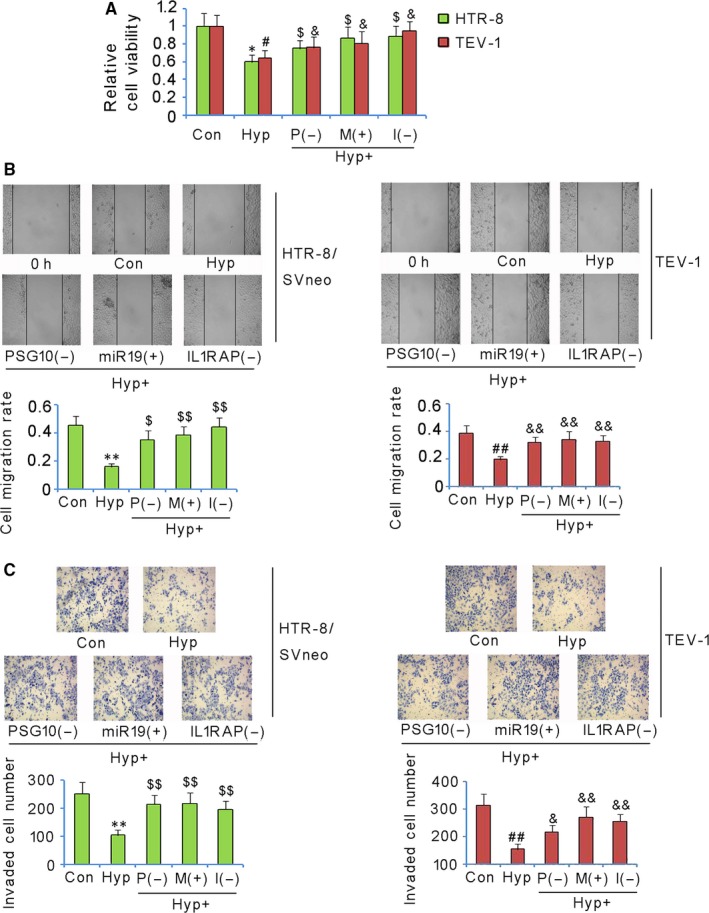
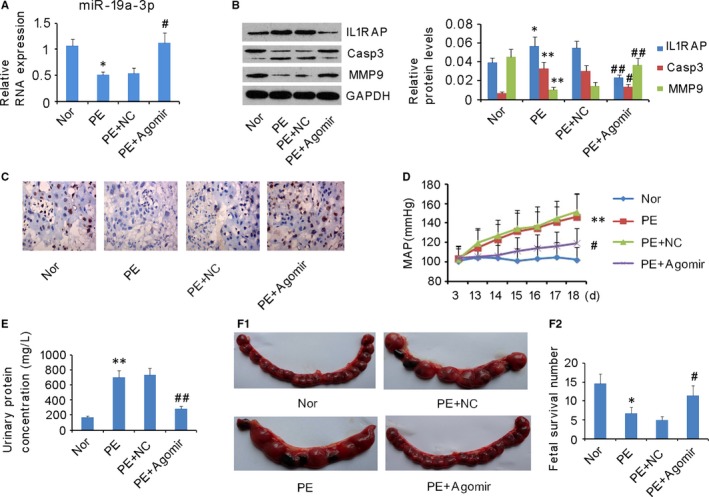
Preeclampsia (PE), a pregnancy-specific disorder, is a leading cause of perinatal maternal-fetal mortality and morbidity. Impaired cell migration and invasion of trophoblastic cells and an imbalanced systemic maternal inflammatory response have been proposed as potential mechanisms of PE pathogenesis. Comparative analysis between PE placentas and normal placentas profiled differentially expressed miRNAs, lncRNAs, and mRNAs, including miR-19a-3p (miRNA), PSG10P (lncRNA), and IL1RAP (mRNA). This study was conducted to investigate their potential roles in PE pathogenesis. The expression of miR-19a-3p, PSG10P, and IL1RAP was examined in PE and normal placentas using RT-qPCR. An in vitro experiment was performed in human trophoblast HET8/SVneo and TEV-1 cells cultured in normoxic and hypoxic conditions. MiR-19a-3p targets were identified using Targetscan, miRanda, and PicTar analysis as well as luciferase reporter assays. The mouse model of PE was conducted using sFlt-1 for in vivo tests. Lower levels of miR-19a-3p, but higher levels of PSG10P and IL1RAP were observed in PE placentas and the trophoblast cells in hypoxia. Luciferase reporter assays confirmed that PSG10P and IL1RAP were both direct targets of miR-19a-3p. Exposure to hypoxia inhibited cell viability, migration, and invasion of HET8/SVneo and TEV-1 cells. Knocking out PSG10P and IL1RAP or overexpressing miR-19a-3p rescued the inhibition caused by hypoxia. In vivo experiments showed that IL1RAP promoted the expression of caspase-3, a key apoptosis enzyme, but inhibited MMP9, which is responsible for degrading the extracellular matrix, suggesting a significant role of IL1RAP in cell proliferation, migration, and invasion. miR-19a-3p, PSG10P, and IL1RAP were all found to be involved in PE pathogenesis. With a common targeting region in their sequences, a regulatory network in the PSG10P/miR-19a-3p/IL1RAP pathway may contribute to PE pathogenesis during pregnancy.
Keywords: IL1RAP; PSG10P; miR-19a-3p; preeclampsia pathogenesis.
© 2018 The Authors. Journal of Cellular and Molecular Medicine published by John Wiley & Sons Ltd and Foundation for Cellular and Molecular Medicine.
Figures
Similar articles
-
A potential regulatory network among WDR86-AS1, miR-10b-3p, and LITAF is possibly involved in preeclampsia pathogenesis.Cell Signal. 2019 Mar;55:40-52. doi: 10.1016/j.cellsig.2018.12.006. Epub 2018 Dec 12. Cell Signal. 2019. PMID: 30552989
-
miR-362-3p regulates cell proliferation, migration and invasion of trophoblastic cells under hypoxia through targeting Pax3.Biomed Pharmacother. 2018 Mar;99:462-468. doi: 10.1016/j.biopha.2018.01.089. Epub 2018 Feb 20. Biomed Pharmacother. 2018. PMID: 29665647
-
Silencing lncRNA-DGCR5 increased trophoblast cell migration, invasion and tube formation, and inhibited cell apoptosis via targeting miR-454-3p/GADD45A axis.Mol Cell Biochem. 2021 Sep;476(9):3407-3421. doi: 10.1007/s11010-021-04161-x. Epub 2021 May 10. Mol Cell Biochem. 2021. PMID: 33973132
-
The Role of ncRNAs in the Immune Dysregulation of Preeclampsia.Int J Mol Sci. 2023 Oct 16;24(20):15215. doi: 10.3390/ijms242015215. Int J Mol Sci. 2023. PMID: 37894897 Free PMC article. Review.
-
HMGA1 Is a Potential Driver of Preeclampsia Pathogenesis by Interference with Extravillous Trophoblasts Invasion.Biomolecules. 2021 May 31;11(6):822. doi: 10.3390/biom11060822. Biomolecules. 2021. PMID: 34072941 Free PMC article. Review.
Cited by
-
Preeclamptic Women Have Disrupted Placental microRNA Expression at the Time of Preeclampsia Diagnosis: Meta-Analysis.Front Bioeng Biotechnol. 2021 Dec 24;9:782845. doi: 10.3389/fbioe.2021.782845. eCollection 2021. Front Bioeng Biotechnol. 2021. PMID: 35004644 Free PMC article. Review.
-
The expression profile of plasmatic exosomal lncRNAs in early-onset preeclampsia by sequencing.Am J Transl Res. 2022 Jun 15;14(6):3806-3823. eCollection 2022. Am J Transl Res. 2022. PMID: 35836847 Free PMC article.
-
Roles of noncoding RNAs in preeclampsia.Reprod Biol Endocrinol. 2021 Jul 2;19(1):100. doi: 10.1186/s12958-021-00783-4. Reprod Biol Endocrinol. 2021. PMID: 34215266 Free PMC article. Review.
-
H2S donor GYY4137 mitigates sFlt-1-induced hypertension and vascular dysfunction in pregnant rats†.Biol Reprod. 2024 Oct 14;111(4):879-889. doi: 10.1093/biolre/ioae103. Biol Reprod. 2024. PMID: 38938086 Free PMC article.
-
Information on dysregulation of microRNA in placenta linked to preeclampsia.Bioinformation. 2021 Jan 31;17(1):240-248. doi: 10.6026/97320630017240. eCollection 2021. Bioinformation. 2021. PMID: 34393443 Free PMC article.
References
MeSH terms
Substances
LinkOut - more resources
Full Text Sources
Research Materials
Miscellaneous
