Loss of the GPI-anchor in B-lymphoblastic leukemia by epigenetic downregulation of PIGH expression
- PMID: 30370942
- PMCID: PMC6587464
- DOI: 10.1002/ajh.25337
Loss of the GPI-anchor in B-lymphoblastic leukemia by epigenetic downregulation of PIGH expression
Abstract
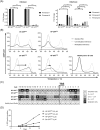
Adult B-lymphoblastic leukemia (B-ALL) is a hematological malignancy characterized by genetic heterogeneity. Despite successful remission induction with classical chemotherapeutics and novel targeted agents, enduring remission is often hampered by disease relapse due to outgrowth of a pre-existing subclone resistant against the treatment. In this study, we show that small glycophosphatidylinositol (GPI)-anchor deficient CD52-negative B-cell populations are frequently present already at diagnosis in B-ALL patients, but not in patients suffering from other B-cell malignancies. We demonstrate that the GPI-anchor negative phenotype results from loss of mRNA expression of the PIGH gene, which is involved in the first step of GPI-anchor synthesis. Loss of PIGH mRNA expression within these B-ALL cells follows epigenetic silencing rather than gene mutation or deletion. The coinciding loss of CD52 membrane expression may contribute to the development of resistance to alemtuzumab (ALM) treatment in B-ALL patients resulting in the outgrowth of CD52-negative escape variants. Additional treatment with 5-aza-2'-deoxycytidine may restore expression of CD52 and revert ALM resistance.
© 2018 The Authors. American Journal of Hematology published by Wiley Periodicals, Inc.
Conflict of interest statement
Nothing to report.
Figures


Similar articles
-
Mutations in PIGA cause a CD52-/GPI-anchor-deficient phenotype complicating alemtuzumab treatment in T-cell prolymphocytic leukemia.Eur J Haematol. 2020 Dec;105(6):786-796. doi: 10.1111/ejh.13511. Epub 2020 Sep 28. Eur J Haematol. 2020. PMID: 32875608
-
High Mutation Frequency of the PIGA Gene in T Cells Results in Reconstitution of GPI Anchor-/CD52- T Cells That Can Give Early Immune Protection after Alemtuzumab-Based T Cell-Depleted Allogeneic Stem Cell Transplantation.J Immunol. 2018 Mar 15;200(6):2199-2208. doi: 10.4049/jimmunol.1701018. Epub 2018 Feb 2. J Immunol. 2018. PMID: 29427418
-
Antibody selection against CD52 produces a paroxysmal nocturnal haemoglobinuria phenotype in human lymphocytes by a novel mechanism.Biochem J. 1997 Mar 15;322 ( Pt 3)(Pt 3):919-25. doi: 10.1042/bj3220919. Biochem J. 1997. PMID: 9148769 Free PMC article.
-
Use of decitabine for patients with refractory or relapsed acute myeloid leukemia: a systematic review and meta-analysis.Hematology. 2019 Dec;24(1):507-515. doi: 10.1080/16078454.2019.1632407. Hematology. 2019. PMID: 31242832
-
Pharmacological approach for optimization of the dose schedule of 5-Aza-2'-deoxycytidine (Decitabine) for the therapy of leukemia.Leukemia. 1997 Feb;11(2):175-80. doi: 10.1038/sj.leu.2400550. Leukemia. 1997. PMID: 9009076 Review.
Cited by
-
Differential Interaction of Peripheral Blood Lymphocyte Counts (ALC) With Different in vivo Depletion Strategies in Predicting Outcomes of Allogeneic Transplant: An International 2 Center Experience.Front Oncol. 2019 Jul 10;9:623. doi: 10.3389/fonc.2019.00623. eCollection 2019. Front Oncol. 2019. PMID: 31355140 Free PMC article.
-
Integrating machine learning and single-cell sequencing to identify shared biomarkers in type 1 diabetes mellitus and clear cell renal cell carcinoma.Front Oncol. 2025 Mar 3;15:1543806. doi: 10.3389/fonc.2025.1543806. eCollection 2025. Front Oncol. 2025. PMID: 40098701 Free PMC article.
-
An epigenetic GPI anchor defect impairs TLR4 signaling in the B cell transdifferentiation model for primary human monocytes BLaER1.Sci Rep. 2021 Jul 22;11(1):14983. doi: 10.1038/s41598-021-94386-z. Sci Rep. 2021. PMID: 34294787 Free PMC article.
References
-
- Fielding AK, Richards SM, Chopra R, et al. Outcome of 609 adults after relapse of acute lymphoblastic leukemia (ALL); an MRC UKALL12/ECOG 2993 study. Blood. 2007;109(3):944‐950. - PubMed
-
- Alinari L, Lapalombella R, Andritsos L, Baiocchi RA, Lin TS, Byrd JC. Alemtuzumab (Campath‐1H) in the treatment of chronic lymphocytic leukemia. Oncogene. 2007;26(25):3644‐3653. - PubMed
-
- Moreton P, Hillmen P. Alemtuzumab therapy in B‐cell lymphoproliferative disorders. Semin Oncol. 2003;30(4):493‐501. - PubMed
Publication types
MeSH terms
Substances
Grants and funding
LinkOut - more resources
Full Text Sources
Molecular Biology Databases
