. 2019 Feb 15;199(4):465-477.
doi: 10.1164/rccm.201807-1291OC.

A Transcriptomic Method to Determine Airway Immune Dysfunction in T2-High and T2-Low Asthma

Affiliations

A Transcriptomic Method to Determine Airway Immune Dysfunction in T2-High and T2-Low Asthma

Michael C Peters et al. Am J Respir Crit Care Med. .

Abstract

Background: Type 2 (T2) inflammation drives airway dysfunction in many patients with asthma; yet, we lack a comprehensive understanding of the airway immune cell types and networks that sustain this inflammation. Moreover, defects in the airway immune system in patients with asthma without T2 inflammation are not established.

Objectives: To determine the gene networks that sustain T2 airway inflammation in T2-high asthma and to explore the gene networks that characterize T2-low asthma.

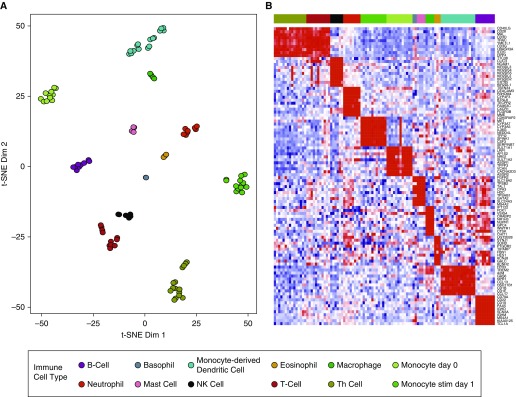
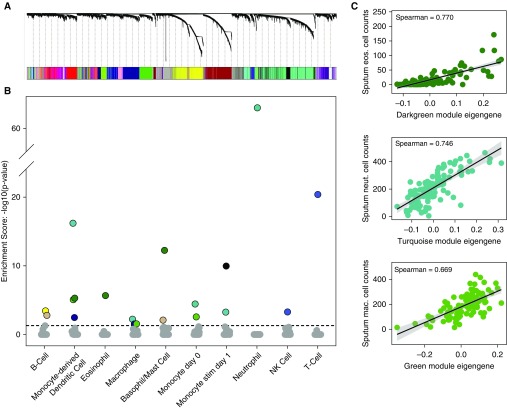
Methods: Network analysis of sputum cell transcriptome expression data from 84 subjects with asthma and 27 healthy control subjects was used to identify immune cell type-enriched networks that underlie asthma subgroups.

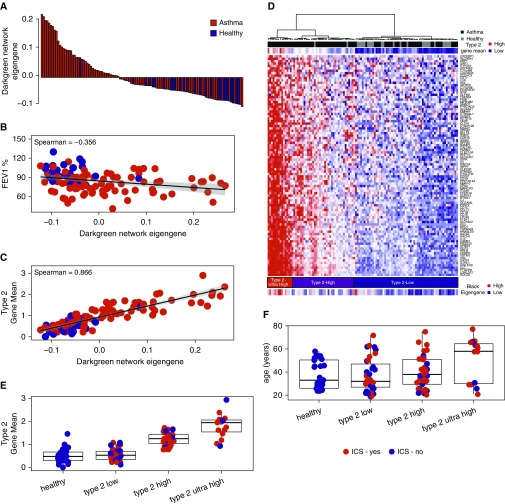
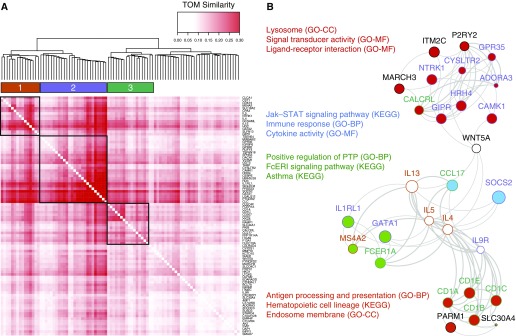
Results: Sputum T2 gene expression was characterized by an immune cell network derived from multiple innate immune cells, including eosinophils, mast cells/basophils, and inflammatory dendritic cells. Clustering of subjects within this network stratified subjects into T2-high and T2-low groups, but it also revealed a subgroup of T2-high subjects with uniformly higher expression of the T2 network. These "T2-ultrahigh subjects" were characterized clinically by older age and more severe airflow obstruction and pathologically by a second T2 network derived from T2-skewed, CD11b+/CD103-/IRF4+ classical dendritic cells. Subjects with T2-low asthma were differentiated from healthy control subjects by lower expression of a cytotoxic CD8+ T-cell network, which was negatively correlated with body mass index and plasma IL-6 concentrations.

Conclusions: Persistent airway T2 inflammation is a complex construct of innate and adaptive immunity gene expression networks that are variable across individuals with asthma and persist despite steroid treatment. Individuals with T2-low asthma exhibit an airway deficiency in cytotoxic T cells associated with obesity-driven inflammation.

Keywords: CD8 cytotoxic T cells; asthma; dendritic cells; sputum gene expression; type 2.


Figures

Figure 1.
Figure 1.
The development of gene sets enriched for specific human immune cell types. (A) Immune cell–enriched gene sets derived from analysis of the Garvan Institute for Medical Research and IRIS (Immune Response In Silico) human immune cell databases separate cell types into distinct clusters in a t-Distributed Stochastic Neighbor Embedding (t-SNE) plot (Tables E1 and E2). (B) Heat map of the top 10 genes from the immune cell type–enriched gene sets. Ordering by cell types shows cellular specificity in expression. Dim = dimension; NK = natural killer; Th = T helper.
Figure 2.
Figure 2.
Weighted gene coexpression analysis of sputum transcriptome data identifies gene networks reflective of specific immune cell types. (A) Weighted gene coexpression analysis hierarchical clustering dendrogram of the 13,536 genes that passed quality control filtering for induced sputum samples. Gene dissimilarity was calculated using topological overlap measure. The colors corresponding to network assignments are given in the bar below the dendrogram. (B) Plot of P values for gene set enrichment score of the immune cell–type gene sets in the sputum networks. Ten sputum networks were highly enriched with genes specific for different immune cells. For example, the dark green network was highly enriched with genes specific for eosinophils, basophils/mast cells, and dendritic cells. (C) Correlation plots between sputum cytospin cell counts and sputum network eigengene expression values. Specifically, correlations between the dark green module eigengene values and eosinophil cell counts, turquoise module eigengene values and neutrophil cell counts, and green module eigengene values and macrophage cell counts are shown. eos. = eosinophil; mac. = macrophage; neut. = neutrophil; NK = natural killer.
Figure 3.
Figure 3.
Sputum transcriptome network analysis identifies a type 2 (T2) inflammation network that clusters subjects with T2-high, T2-ultrahigh, and T2-low asthma. (A, B) Eigengene values of the dark green network were robustly increased in subjects with asthma (black) compared with healthy control subjects (light gray) and were associated with lower FEV1 values. (C) A summary metric of IL-4, IL-5, and IL-13 airway T2 gene expression (T2 gene mean) was strongly associated with the dark green network eigengene values. (D) Hierarchical clustering of subjects based on expression of genes in the dark green network resulted in three primary clusters. Cluster 1 was characterized by low T2 gene expression and contained an equal distribution of subjects with asthma (n = 35) and healthy control subjects (n = 25). Cluster 2 was characterized by high T2 gene expression and consisted predominately of subjects with asthma (n = 34) and few healthy control subjects (n = 2). Cluster 3 was characterized by extremely high T2 gene expression (T2-ultrahigh) and was comprised exclusively of subjects with asthma (n = 15). Black network eigengene values strongly correlated with dark green network eigengene values. (E) The T2 gene mean was robustly higher in subjects with T2-ultrahigh asthma. (F) Subjects with T2-ultrahigh asthma are characterized by older age. ICS = inhaled corticosteroids.
Figure 4.
Figure 4.
A multicellular innate immunity network underlies asthmatic persistent type 2 inflammation. (A) Topological overlap measure (TOM) plot showing the subclusters of dark green network genes with highly correlated expression. The heat map is based on correlations of dissimilarity between genes. (B) FGNet enrichment results for the genes within the dark green module. The four enrichment metagroups are denoted by the fill of the node (gene) colors, where genes involved in multiple metagroups are filled in white. The gene subclusters identified in A are denoted by the node outline colors, where a black outline indicates that the gene was not within any of the three subclusters in A. FCeRI = high-affinity IgE receptor; GO-BP = Gene Ontology–Biological Process; GO-CC = Gene Ontology–Cellular Component; GO-MF = Gene Ontology–Molecular Function; KEGG = Kyoto Encyclopedia of Genes and Genomes; PTP = protein tyrosine phosphatase; STAT = signal transducer and activator of transcription.
Figure 5.
Figure 5.
A type 2 (T2) inflammation–skewed CD11b+IRF4+CD103 classical dendritic cell (DC) sputum network is increased in T2-high asthma. (A) ZBTB46 (zinc finger and BTB domain containing 46) and FLT3 (fms-related tyrosine kinase 3), two genes highly specific for classical DCs, are tightly correlated with the eigengene values of the black module. (B) Gene expression for the DC surface marker CD11B and the CD11B DC transcription factor IRF4 (IFN-regulatory factor 4) are tightly correlated with the eigengene values of the black module. (C) The cell surface marker CD103 and the CD103+ DC transcription factor IRF8 are negatively correlated to the eigengene values of the black network. Circles represent each subject and are shaded according to the expression of the T2 gene mean (red = high expression; blue = low expression). (D) Gene set enrichment analysis. The green curve displays the running enrichment score for the black network genes as the analysis walks down the ranked distribution of genes ordered by fold change in expression between CD11b+CD103 DCs versus CD11bC103+ DCs. Genes are represented by the vertical black bars. P < 0.001.
Figure 6.
Figure 6.
The sputum gene expression network enriched for cytotoxic CD8+ T-cell genes is decreased in type 2 inflammation–low asthma and associated with body mass index (BMI). (A) The cell surface markers of CD8+ T cells, CD3 and CD8, are strongly correlated to eigengene values for the royal blue module. (B) KLRB1 (killer cell lectin-like receptor B1) gene expression is strongly correlated to eigengene values for the royal blue module. (C) Genes for cytotoxic function, PRF1 (perforin 1) and GZMB (granzyme B), are strongly correlated to eigengene values for the royal blue module. (D) CD8+ T-cell transcription factors EOMES (eomesodermin) and TBX21 (T-box 21) are strongly correlated to eigengene values for the royal blue module. (E) Gene set enrichment analysis. The green curve displays the enrichment score for the royal blue network genes as the analysis walks down the ranked distribution of genes ordered by fold change in expression between CD8+ T cells relative to all other immune cell types. Genes are represented by the vertical black bars. (F) Eigengene values of the royal blue module are strongly negatively correlated to BMI and plasma IL-6 concentration. Red dots represent subjects with asthma, and blue dots represent healthy control subjects. KLRK1 = killer cell lectin-like receptor K1.

Comment in

References

    1. GBD 2015 Chronic Respiratory Disease Collaborators. Global, regional, and national deaths, prevalence, disability-adjusted life years, and years lived with disability for chronic obstructive pulmonary disease and asthma, 1990-2015: a systematic analysis for the Global Burden of Disease Study 2015. Lancet Respir Med. 2017;5:691–706. - PMC - PubMed
    1. Chung KF, Wenzel SE, Brozek JL, Bush A, Castro M, Sterk PJ, et al. International ERS/ATS guidelines on definition, evaluation and treatment of severe asthma. Eur Respir J. 2014;43:343–373. - PubMed
    1. Fahy JV. Type 2 inflammation in asthma—present in most, absent in many. Nat Rev Immunol. 2015;15:57–65. - PMC - PubMed
    1. Mohapatra A, Van Dyken SJ, Schneider C, Nussbaum JC, Liang HE, Locksley RM. Group 2 innate lymphoid cells utilize the IRF4-IL-9 module to coordinate epithelial cell maintenance of lung homeostasis. Mucosal Immunol. 2016;9:275–286. - PMC - PubMed
    1. Nussbaum JC, Van Dyken SJ, von Moltke J, Cheng LE, Mohapatra A, Molofsky AB, et al. Type 2 innate lymphoid cells control eosinophil homeostasis. Nature. 2013;502:245–248. - PMC - PubMed

Publication types

MeSH terms