. 2018 Sep 4;7(17):e009052.
doi: 10.1161/JAHA.118.009052.

Immune-Mediated Myocarditis in Fabry Disease Cardiomyopathy

Affiliations

Immune-Mediated Myocarditis in Fabry Disease Cardiomyopathy

Andrea Frustaci et al. J Am Heart Assoc. .

Abstract

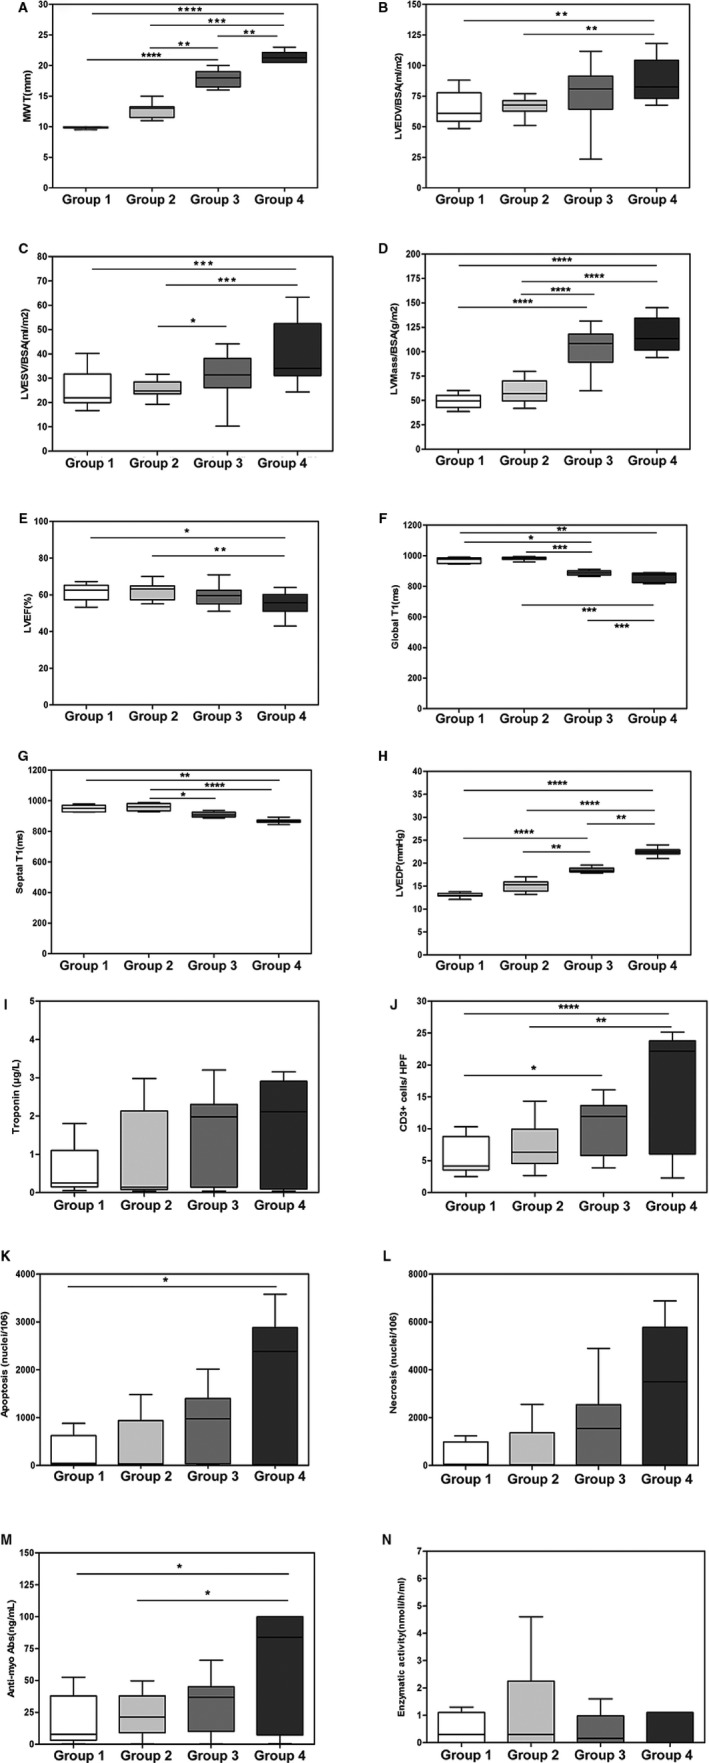
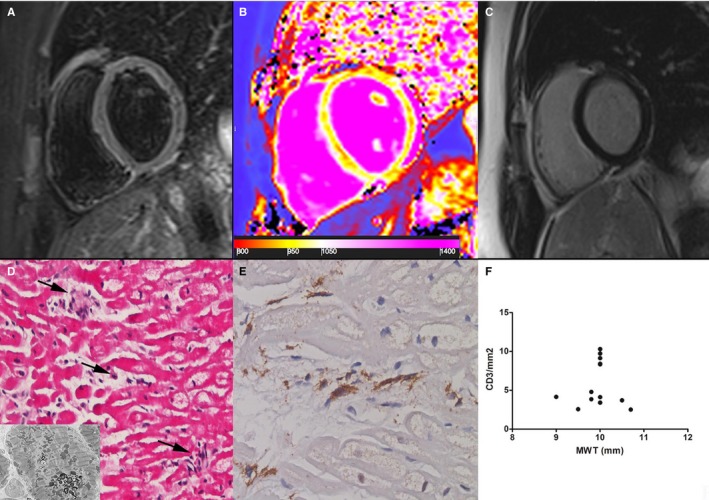
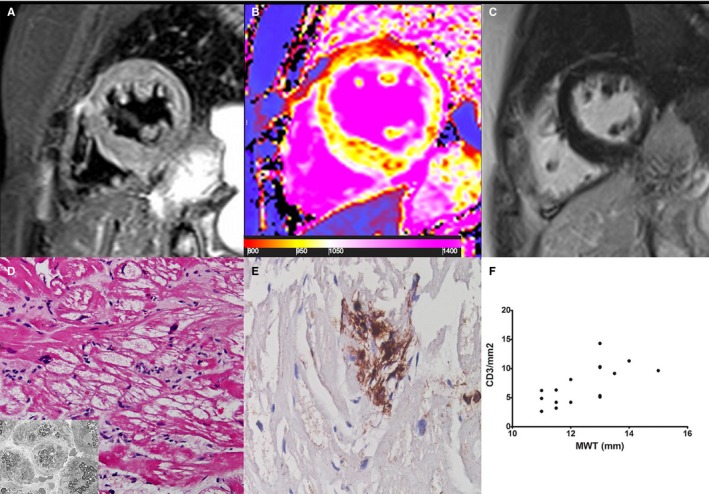
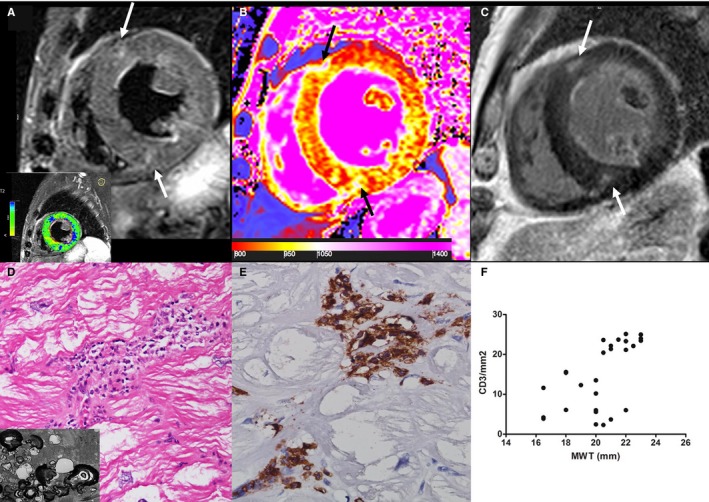
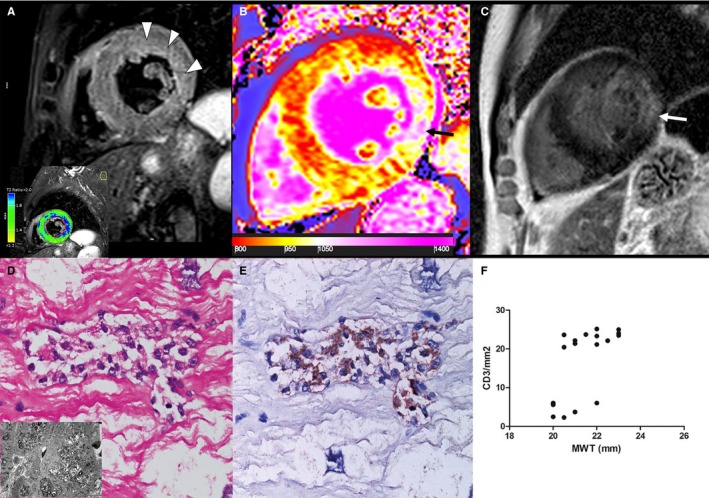
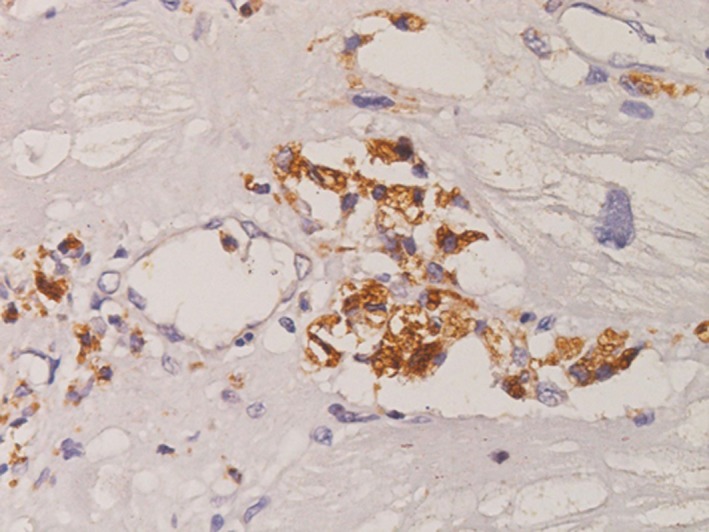
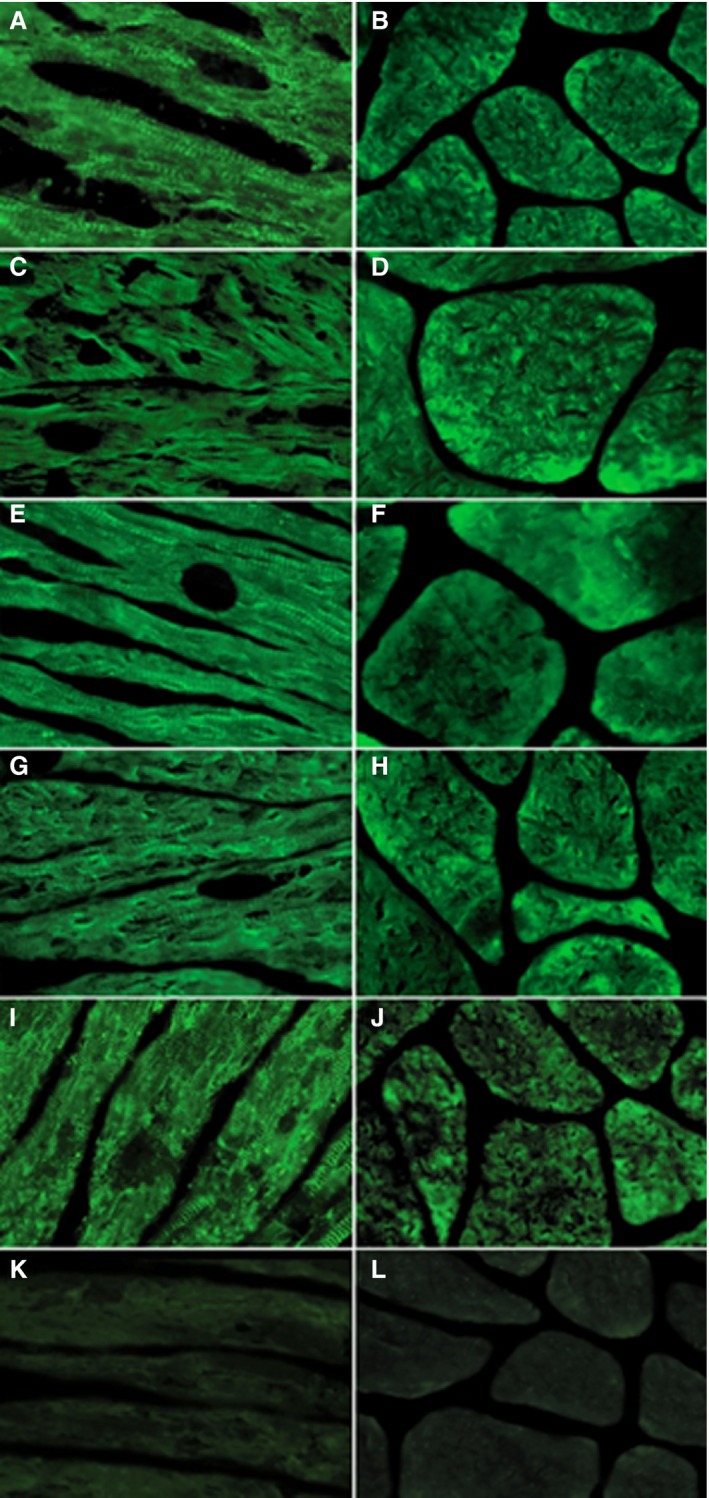
Background Glycosphingolipid accumulation in Fabry cells generates a proinflammatory response that may influence disease evolution and responsiveness to enzyme replacement therapy. This study evaluated incidence, mechanism, and impact of myocarditis in Fabry disease cardiomyopathy ( FDCM ). Methods and Results Myocarditis, defined as CD 3+ T lymphocytes >7/mm2 associated with necrosis of glycolipid-laden myocardiocytes, was retrospectively evaluated in endomyocardial biopsies from 78 patients with FDCM : 13 with maximal wall thickness (MWT) <11 mm (group 1), 17 with MWT 11 to 15 mm (group 2), 30 with MWT 16 to 20 mm (group 3), and 18 with MWT >20 mm (group 4). Myocarditis was investigated by polymerase chain reaction for cardiotropic viruses, by serum antiheart and antimyosin antibodies, and by cardiac magnetic resonance. Myocarditis was recognized at histology in 48 of 78 patients with FDCM (38% of group 1, 41% of group 2, 66% of group 3, and 72% of group 4). Myocarditis was characterized by positive antiheart and antimyosin antibodies and negative polymerase chain reaction for viral genomes. CD 3+ cells/mm2 correlated with myocyte necrosis, antimyosin autoantibody titer, and MWT ( P<0.001, r=0.79; P<0.001, r=0.84; P<0.001, r=0.61, respectively). Cardiac magnetic resonance showed myocardial edema in 24 of 78 patients (31%): 0% of group 1, 23% of group 2, 37% of group 3, and 50% of group 4. Conclusions Myocarditis is detectable at histology in up to 56% of patients with FDCM . It is immune mediated and correlates with disease severity. It can be disclosed by antiheart/antimyosin autoantibodies and in the advanced phase by cardiac magnetic resonance. It may contribute to progression of FDCM and resistance to enzyme replacement therapy.

Keywords: Fabry disease; cardiomyopathy; heart failure; myocarditis.


Figures

Figure 1
Figure 1
Box plot distribution by group for definition of relevant variables. A, Maximal wall thickness (MWT; mm). B, Left ventricular end‐diastolic volume/body surface area (LVEDV/BSA; mL/m2). C, Left ventricular end‐systolic volume/body surface area (LVESV/BSA; mL/m2). D, Left ventricular mass/body surface area (LV mass/BSA; g/m2). E, Left ventricular ejection fraction (LVEF; %). F, Global T1 (ms). G, Septal T1 (ms). H, Left ventricular end‐diastolic pressure (LVEDP; mm Hg). I, Troponin I (μg/L). L, CD3+ cells/high‐power field (HPF). J, Apoptosis (nuclei/106). K, Necrosis (nuclei/106). L, Antimyosin autoantibodies (ng/mL). M, Enzymatic activity (nmol/h/mL). Comparison among groups was performed using the Dunn test. *P<0.05; **P<0.01; ***P<0.001; ****P<0.0001.
Figure 2
Figure 2
Group 1 patient. A 22‐year‐old woman with prehypertrophic Fabry disease cardiomyopathy (maximal wall thickness [MWT]: 8 mm) showing normal myocardium in a T2‐weighted short τ inversion recovery image (A) and a late gadolinium–enhanced image (C). Analysis of T1 mapping (B) showed a reduced septal T1 value (923±30 ms, n.v. 960–990 ms), reflecting initial tissue lipid accumulation. D, At histology (hematoxylin and eosin, ×200), cardiomyocytes are intermittently enlarged because of cytoplasm vacuoles that, at electron microscopy, consist of myelin bodies (insert) and are focally (arrows) surrounded by CD3+ infiltrates (E) with cell necrosis. F, Correlation between MWT and CD3 count (P=ns) in all group 1 patients (n=13).
Figure 3
Figure 3
Group 2 patient. A 61‐year‐old woman with Fabry disease cardiomyopathy and mild hypertrophy (maximal wall thickness [MWT]: 14 mm). A T2‐weighted short τ inversion recovery image (A) and a late gadolinium–enhanced image (C) do not show clear areas of myocardial edema or enhancement (T2 ratio: 1.7). Native T1 map (B) shows some patchy areas of focal reduction of T1 (red spots within septum and ventricular wall) with a global mild decrease in myocardial T1 value (946±39 ms, n.v. 960–990 ms) as an expression of tissue accumulation of sphingolipidis. D, At histology (hematoxylin and eosin, ×200), cardiomyocytes are intermittently hypertrophied and vacuolated. Vacuoles, consisting of myelin bodies (insert), are focally damaged by CD3+ inflammatory cells (E). F, Correlation between MWT and CD3 count (P<0.001, ρ=0.70) in all group 2 patients (n=17).
Figure 4
Figure 4
Group 3 patient. A 65‐year‐old man with Fabry disease cardiomyopathy and moderate cardiac hypertrophy (maximal wall thickness [MWT]: 19 mm). On a T2‐weighted short τ inversion recovery image (A), some mesocardial foci (arrows) of myocardial edema are detectable at anterior and inferior interventricular junctions, matching enhanced areas (arrows) on a late gadolinium–enhanced image (C); analysis of T2‐weighted myocardium‐over‐skeletal muscle signal intensity ratio reveals myocardial edema in the inferolateral wall (blue myocardium in the lower box is T2 ratio ≥2.0). B, A diffuse marked decrease of T1 value (septum: 834±57 ms) is represented by a predominant red color in myocardium with areas of increase signal (1093–1170 ms) of fibrous replacement at interventricular insertions (black arrows). D, At histology (hematoxylin and eosin, ×200), severely hypertrophied and vacuolated cardiomyocytes are surrounded by CD3+ inflammatory cells (D and E). Insert in D shows vacuoles consisting of glycolipid bodies. F, Correlation between MWT and CD3 count (P<0.001, ρ=0.62) in all group 3 patients (n=30).
Figure 5
Figure 5
Group 4 patient. A 65‐year‐old man with Fabry disease cardiomyopathy (FDCM) and severe hypertrophy (maximal wall thickness [MWT]: 22 mm). A, T2‐weighted short τ inversion recovery shows a diffuse hyperintense signal of subendocardial midwall layers of lateral wall (arrowheads), as detected by the comparison with skeletal muscle signal (blue color, T2 ratio ≥2.0), reflecting myocardial edema. Native T1 map (B) and a late gadolinium–enhanced (LGE) image (C) demonstrate a severe decrease of myocardial T1 (septum: 867±42 ms), reflecting lipid accumulation and an LGE area at inferolateral wall (arrows), as a distinctive cardiac magnetic resonance hallmark of FDCM, corresponding to fibrous replacement (nT1: 1131±64 ms). D, Inflammatory infiltrate (hematoxylin and eosin, ×200), mainly of CD3+lymphocytes (E), was associated with necrosis of adjacent glycolipid‐laden myocytes. Insert in D shows vacuoles consisting of myelin bodies. F, Correlation between MWT and CD3 count (P<0.001, ρ=0.67) in all group 4 patients (n=18).
Figure 6
Figure 6
CD3+ T lymphocytes infiltrating myocardial capillaries in advanced (group 4) Fabry disease cardiomyopathy (×200 magnification, immunoperoxidase for T lymphocyte CD3 antigen).
Figure 7
Figure 7
Antiheart autoantibodies in Fabry disease patients by indirect immunofluorescence. A, C, E and G, Strongly positive fine striational pattern of positivity on human heart tissue in sera from groups 1, 2, 3, and 4, respectively (×400). B, D, F and H, Weakly positive fine striational pattern on human skeletal muscle in sera from groups 1, 2, 3, and 4, respectively (×400), suggesting a partially organ‐specific (or cross‐reactive 1) pattern. I, Positive antiheart autoantibodies control serum on heart tissue (×400). J, Positive antiheart autoantibodies control serum on human skeletal muscle (×400). K, Negative antiheart autoantibodies control serum on human heart tissue (×400). L, Negative control serum on human skeletal muscle (×400).

References

    1. Desnick RJ, Ioannou YA, Eng CM. Alpha‐galactosidase a deficiency: Fabry disease In: Scriver CR, Beaudet Al, Sly WS, Valle D, eds. The metabolic and molecular bases of inherited disease. New York, NY: McGraw‐Hall; 2001:3733–3774.
    1. Desnick RJ. Fabry's disease (αGalactosidase A Deficiency): an X‐linked Nephropathy In: Lifton R, Somlo S, Giebisch, G, Seldin D, eds. Genetic Diseases of the Kidney. San Diego, CA: Elsevier Academic Press; 2009:597–616.
    1. Germain DP. Fabry disease. Orphanet J Rare Dis. 2010;5:1–49. - PMC - PubMed
    1. Thurberg BL, Fallon JT, Mitchell R, Aretz T, Gordon RE, O'Callaghan MW. Cardiac microvascular pathology in Fabry disease: evaluation of endomyocardial biopsies before and after enzyme replacement therapy. Circulation. 2009;119:2561–2567. - PubMed
    1. Najafian B, Savarstad E, Bostad L, Gubler MC, Tondel C, Whitley C, Mauer M. Progressive podocyte injury and globotriasylceramide (GL‐3) accumulation in young patients with Fabry disease. Kidney Int. 2011;79:663–670. - PMC - PubMed

Publication types

MeSH terms