. 2018 Sep 4;7(17):e007898.
doi: 10.1161/JAHA.117.007898.

Discordant Alternans as a Mechanism for Initiation of Ventricular Fibrillation In Vitro

Affiliations

Discordant Alternans as a Mechanism for Initiation of Ventricular Fibrillation In Vitro

Laura M Muñoz et al. J Am Heart Assoc. .

Abstract

Background Ventricular tachyarrhythmias are often preceded by short sequences of premature ventricular complexes. In a previous study, a restitution-based computational model predicted which sequences of stimulated premature complexes were most likely to induce ventricular fibrillation in canines in vivo. However, the underlying mechanism, based on discordant-alternans dynamics, could not be verified in that study. The current study seeks to elucidate the mechanism by determining whether the spatiotemporal evolution of action potentials and initiation of ventricular fibrillation in in vitro experiments are consistent with model predictions. Methods and Results Optical mapping voltage signals from canine right-ventricular tissue (n=9) were obtained simultaneously from the entire epicardium and endocardium during and after premature stimulus sequences. Model predictions of action potential propagation along a 1-dimensional cable were developed using action potential duration versus diastolic interval data. The model predicted sign-change patterns in action potential duration and diastolic interval spatial gradients with posterior probabilities of 91.1%, and 82.1%, respectively. The model predicted conduction block with 64% sensitivity and 100% specificity. A generalized estimating equation logistic-regression approach showed that model-prediction effects were significant for both conduction block ( P<1×10-15, coefficient 44.36) and sustained ventricular fibrillation ( P=0.0046, coefficient, 1.63) events. Conclusions The observed sign-change patterns favored discordant alternans, and the model successfully identified sequences of premature stimuli that induced conduction block. This suggests that the relatively simple discordant-alternans-based process that led to block in the model may often be responsible for ventricular fibrillation onset when preceded by premature beats. These observations may aid in developing improved methods for anticipating block and ventricular fibrillation.

Keywords: alternans; arrhythmia (mechanisms); computer‐based model; electrophysiology; ventricular fibrillation.


Figures

Figure 1
Figure 1
Main stages of the hypothesized mechanism by which premature complexes induce VF. In the top row, premature complexes induce spatially discordant alternans, leading to conduction block, reentrant waves, and VF in vitro. The 1D coupled maps model is capable of simulating the first 3 stages in silico, as shown in the bottom row. Dashed lines indicate pairs of stages that were compared in each of the hypotheses of the study. For instance, the VF‐Prediction Hypothesis asserts that there was a relationship between model‐predicted block and observed VF (specifically that sequences of premature stimuli that tend to produce block in the model would predictably induce VF in vitro). 1D indicates 1‐dimensional; VF, ventricular fibrillation.
Figure 2
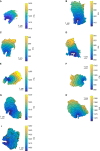
Figure 2
Activation maps of S1 APs for Dogs 1 through 9. Each 2‐dimensional map shows activation times (in milliseconds) measured on the endocardial surface for an S1 AP. Each map was obtained from one of the 18 randomly selected trials that were used to test the Alternans‐Pattern‐Prediction and Block‐Prediction Hypotheses. A, B, …, I correspond to Dogs 1, 2, …, 9, respectively. AP indicates action potential.
Figure 3
Figure 3
Time‐series optical data. In each subplot, membrane potential (dimensionless, normalized to a scale of 0 to 10 000) is plotted against time (milliseconds), for a pixel with coordinates near the center of the field of view on the endocardial surface. Stimulated APs are labeled S1, S2, etc. The remaining APs were not stimulated. Several of these nonstimulated APs (ie, spontaneous complexes) are labeled A1, A2, etc, for later reference. A, SLSL stimulus trial (Trial NB) recorded from pixel with coordinates (60, 60) in RV of Dog 4. The stimulus sequence was not predicted to cause block, and sustained VF did not occur in vitro. B, SLSI stimulus trial (Trial 1) recorded from pixel with coordinates (60, 60) in RV of Dog 4. The stimulus sequence was not predicted to cause block, and sustained VF did not occur in vitro. C, SLSI stimulus trial (Trial VF) recorded from pixel (60, 60) in RV of Dog 4. The stimulus sequence was not predicted to cause block, and sustained VF occurred in vitro. D, SLSI stimulus trial (Trial 2) recorded from pixel (70, 70) in RV of Dog 9. The stimulus sequence was predicted to cause block, and sustained VF did not occur in vitro. AP indicates action potential; RV, right ventricle; VF, ventricular fibrillation.
Figure 4
Figure 4
ΔAPD/Δx and ΔDI/Δx vs stimulus index for Trials 1 and 2. Black dashed lines with asterisks indicate model‐predicted values, and red solid lines with squares represent measured values. A and B, An example of good agreement between modeled and measured values, from an SLSI stimulus sequence applied to the RV of Dog 4. C and D, An example of poor agreement, from an SLSI stimulus sequence applied to the RV of Dog 9. APD indicates action potential duration; DI, diastolic interval; RV, right ventricle.
Figure 5
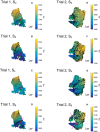
Figure 5
Activation maps for S2–S5 APs for Trials 1 and 2. Endocardial activation times (in milliseconds) are shown for Trial 1 from Dog 4 and Trial 2 from Dog 9. The green squares surround the proximal regions, while the red squares surround the distal regions. A–D, Activation maps for S2–S5 APs for Trial 1, in which an SLSI premature stimulus sequence was applied to the RV of Dog 4. This trial was in the “good” category of agreement scores with coupled maps model predictions of discordant alternans patterns. E–H, Activation maps for S2–S5 APs for Trial 2, in which a SLSI premature stimulus sequence was applied to the RV of Dog 9. This trial was in the “poor” category of agreement scores with coupled maps model predictions of discordant alternans patterns. Regions of conduction block, on the S5 AP wave fronts, which are closest to the stimulating electrode are indicated with pink arrows in D and H. AP indicates action potential; RV, right ventricle.
Figure 6
Figure 6
Spatial gradients of APD and activation maps for S5 APs for Trials NB, 1, and VF. A–C, ΔAPD/Δx vs stimulus index for Trial NB (SLSL, left), Trial 1 (SLSI, middle) and Trial VF (SLSI, right), recorded from tests of premature stimulus sequences on RV of Dog 4. Black dashed lines with asterisks indicate model‐predicted values, and red solid lines with squares represent the measured values. D–F, 2‐dimensional spatial maps of activation times (in milliseconds) measured on the endocardial surface for the S5 AP, for Trial NB (left), Trial 1 (middle), and Trial VF (right). The green square surrounds the proximal region, while the red square surrounds the distal region. Regions of conduction block, on the S5 AP wave fronts, which are closest to the stimulating electrode, are indicated with pink arrows in E and F. AP indicates action potential; APD, action potential duration; NB, no block; RV, right ventricle; VF, ventricular fibrillation.
Figure 7
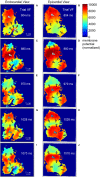
Figure 7
Spontaneous complexes following S5 AP during Trial 1. Endocardial view (left), with corresponding epicardial view (right) of 2‐dimensional spatial membrane potential data (dimensionless, normalized to a scale of 0 to 10 000), recorded from a test of an SLSI premature stimulus sequence on RV of Dog 4. Sustained VF was not induced. The spatial scales are the same in both the endocardial and epicardial images, and the epicardial view was registered to match the orientation of the endocardial view. Arrows indicate the directions of propagation of AP wave fronts and wave backs. A, Frame recorded at 730 ms shows the emergence of the S5 AP, along with the retreating wave back of the S4 AP. The stimulating electrode tip is located near the purple star. Pink parallel lines indicate the location of conduction block. B, Epicardial view at 730 ms. The S4 AP wave back was retreating, and the S5 AP had reached the epicardial surface. C and D, Views of the exiting S5 AP wave back at 808 ms. In C, a spontaneous complex, labeled A1, appeared at the location marked with a blue asterisk. A1 was classified as a “focal” spontaneous complex, since A1 appeared to emerge spontaneously from a localized region on the endocardium, rather than being caused by reentry. E and F, Views of the exiting A1 AP wave back at 920 ms. In E, another spontaneous focal complex, labeled A2, emerged from the location marked with a blue asterisk. G and H, Views from 1096 ms, showing a spontaneous focal complex, labeled A3, which appeared to emerge from the boundary of the RV (in the lower left corner of the image) and proceeded to propagate throughout the ventricle. I and J, Views from 1282 ms, showing a spontaneous focal complex, labeled A4, which appeared to emerge from the same location as A3. A4 subsequently propagated throughout the ventricle. After the events shown in this figure, 4 additional spontaneous complexes that behaved similarly to A3 and A4 were observed after A4, but no reentrant activity was observed. A movie of the optical mapping data from this trial is available in Movie S3. AP indicates action potential; RV, right ventricle; VF, ventricular fibrillation.
Figure 8
Figure 8
Reentry following S5 AP during Trial VF. Endocardial view (left), with corresponding epicardial view (right) of 2‐dimensional spatial membrane potential data (dimensionless, normalized to a scale of 0 to 10 000), recorded from a test of an SLSI premature stimulus sequence on RV of Dog 4. Sustained VF was induced. The spatial scales are the same in both the endocardial and epicardial images, and the epicardial view was registered to match the orientation of the endocardial view. Arrows indicate the directions of propagation of AP wave fronts and wave backs. A, Frame recorded at 804 ms shows the emergence of the S5 AP, along with the retreating wave back of the S4 AP. The stimulating electrode tip is located near the purple star. B, Epicardial view at 804 ms. The S4 AP wave back was retreating, while the S5 AP had not yet reached the epicardial surface. C and D, Views of S5 AP propagation at 880 ms. In C, a spontaneous complex, labeled A1, appeared at the location marked with a blue asterisk. E and F, Views of A1 AP propagation at 970 ms. In E, a spontaneous complex, labeled A2, emerged from the A1 AP, at the location marked with a blue asterisk, and propagated into the region near the electrode. G and H, Views from 1028 ms, showing the propagation of the A2 AP. In G, a portion of the A2 wave front encountered slow conduction near the region marked with a pink “x.” I and J, Views from 1070 ms, showing the propagation of the A2 AP. After activating the region of slow conduction, a portion of the A2 AP reentered the region near the electrode, as shown in I, where the reentrant wave front is labeled with an “R.” After the events shown in this figure, another cycle of reentry, similar to the process shown in G and I, was observed, followed by increasingly disorganized propagation and VF. A movie of the optical mapping data from this trial is available in Movie S3. AP indicates action potential; RV, right ventricle; VF, ventricular fibrillation.

References

    1. Kong MH, Fonarow GC, Peterson ED, Curtis AB, Hernandez AF, Sanders GD, Thomas KL, Hayes DL, Al‐Khatib SM. Systematic review of the incidence of sudden cardiac death in the United States. J Am Coll Cardiol. 2011;57:794–801. - PMC - PubMed
    1. Teodorescu C, Reinier K, Dervan C, Uy‐Evanado A, Samara M, Mariani R, Gunson K, Jui J, Chugh SS. Factors associated with pulseless electric activity versus ventricular fibrillation: the Oregon sudden unexpected death study. Circulation. 2010;122:2116–2122. - PubMed
    1. Kay GN, Plumb VJ, Arciniegas JG, Henthorn RW, Waldo AL. Torsade de pointes: the long‐short initiating sequence and other clinical features: observations in 32 patients. J Am Coll Cardiol. 1983;2:806–817. - PubMed
    1. Gomes JA, Alexopoulos D, Winters SL, Deshmukh P, Fuster V, Suh K. The role of silent ischemia, the arrhythmic substrate and the short‐long sequence in the genesis of sudden cardiac death. J Am Coll Cardiol. 1989;14:1618–1625. - PubMed
    1. el‐Sherif N, Gough WB, Restivo M. Reentrant ventricular arrhythmias in the late myocardial infarction period: mechanism by which a short‐long‐short cardiac sequence facilitates the induction of reentry. Circulation. 1991;83:268–278. - PubMed

Publication types

MeSH terms

LinkOut - more resources