. 2018 Oct 29:10.1038/nbt.4260.
doi: 10.1038/nbt.4260. Online ahead of print.

Identification of spatially associated subpopulations by combining scRNAseq and sequential fluorescence in situ hybridization data

Affiliations

Identification of spatially associated subpopulations by combining scRNAseq and sequential fluorescence in situ hybridization data

Qian Zhu et al. Nat Biotechnol. .

Abstract

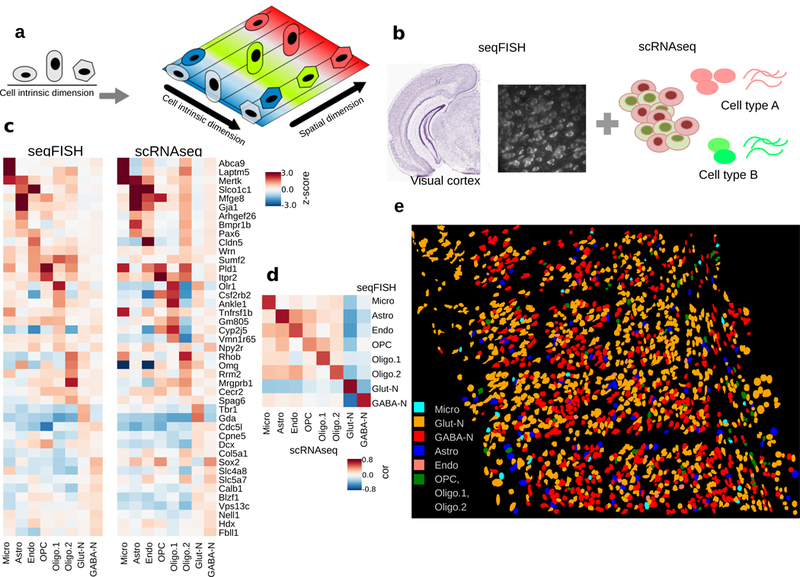
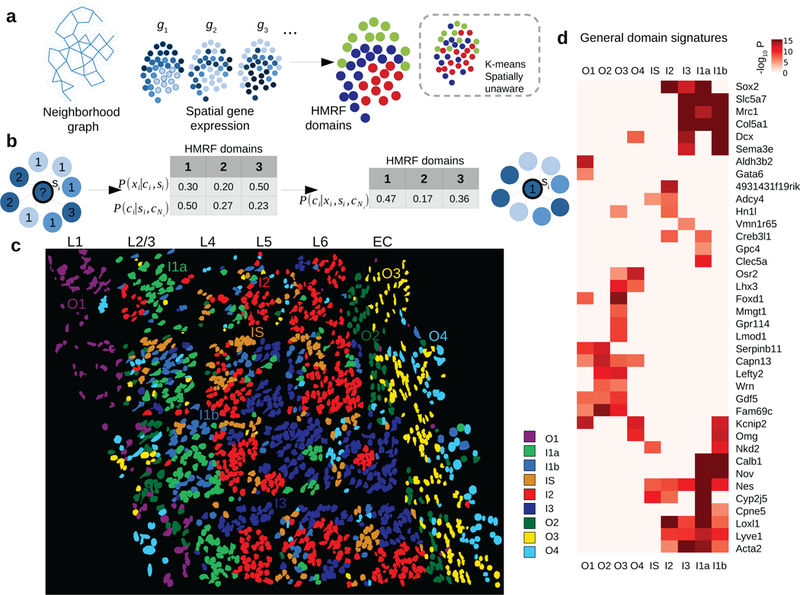
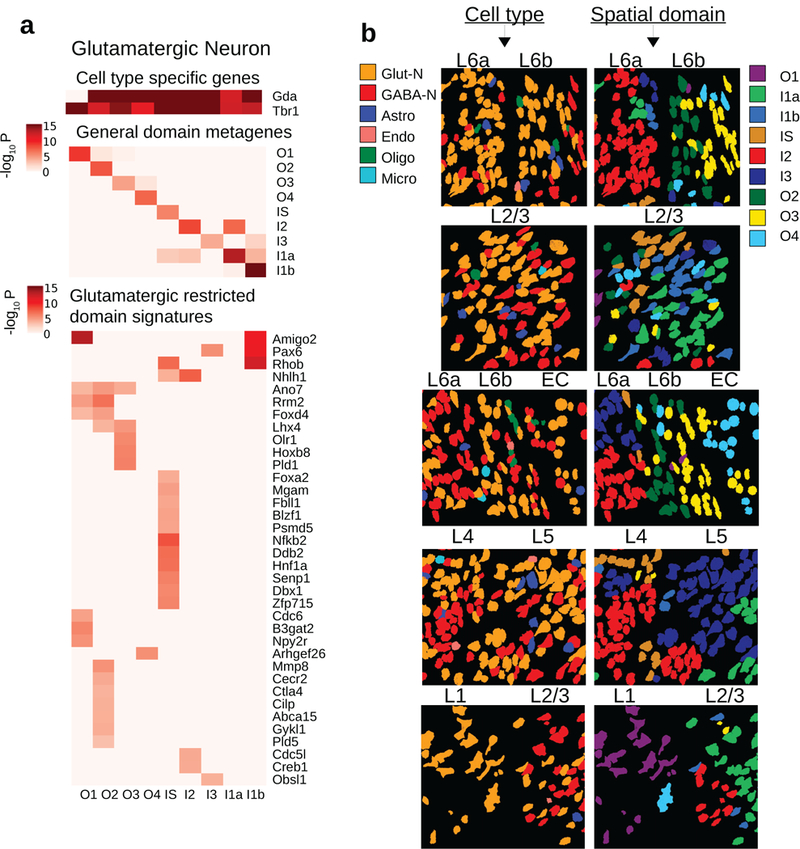
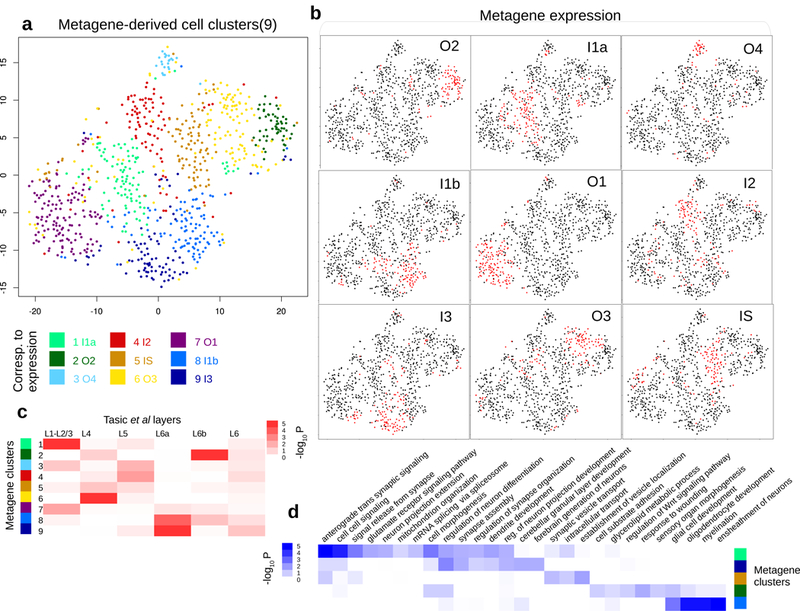
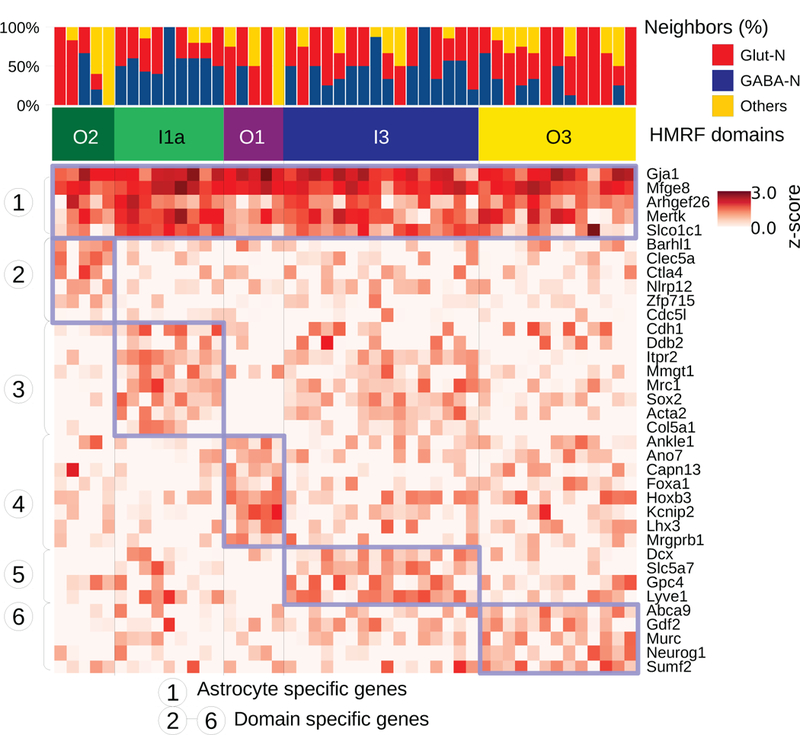
How intrinsic gene-regulatory networks interact with a cell's spatial environment to define its identity remains poorly understood. We developed an approach to distinguish between intrinsic and extrinsic effects on global gene expression by integrating analysis of sequencing-based and imaging-based single-cell transcriptomic profiles, using cross-platform cell type mapping combined with a hidden Markov random field model. We applied this approach to dissect the cell-type- and spatial-domain-associated heterogeneity in the mouse visual cortex region. Our analysis identified distinct spatially associated, cell-type-independent signatures in the glutamatergic and astrocyte cell compartments. Using these signatures to analyze single-cell RNA sequencing data, we identified previously unknown spatially associated subpopulations, which were validated by comparison with anatomical structures and Allen Brain Atlas images.


Conflict of interest statement

Competing Interests

None.

Figures

Figure 1:
Figure 1:
Overall goal of the project and cell type prediction in seqFISH data. a. Cellular heterogeneity is driven by both cell-type (indicated by shape) and environmental factors (indicated by colors). ScRNAseq based studies can only detect cell-type related variation, because spatial information is lost. b. Our goal is to decompose the contributions of each factor by developing methods to integrate scRNAseq and seqFISH data. c. Prediction results evaluated by the comparison of cell-type average expression profile across technologies for 8 major cell types. Values represent expression z-scores. SVM was tuned for the parameter C, which was set to 1e-5 to optimize the cross-platform cell-type to cell-type correlations. The major cell types in the scRNAseq data set – Astro (n=43 cells), Endo (n=29), GABA-N (n=761), Glut-N (n=812), Micro (n=22), OPC (n=19), Oligo.1 (n=6), and Oligo.2 (n=31) – are mapping to 97, 11, 556, 859, 22, 8, 21, and 23 cells in the seqFISH data set. d. Pearson correlation between reference and predicted cell type averages ranges from 0.75 to 0.95. e. Integration of seqFISH and scRNAseq data (illustrated by b) enables cell-type mapping with spatial information in the adult mouse visual cortex. Each cell type is labeled by a different color. Cell shape information is obtained from segmentation of cells from images (see Methods). One mouse brain was assayed by seqFISH due to experimental cost.
Figure 2.
Figure 2.
Spatial domain dissection in seqFISH data using hidden Markov random field (HMRF) approach. a. A schematic overview of the HMRF model. A neighborhood graph represents the spatial relationship between imaged cells (indicated by the circles) in the seqFISH data. The edges connect cells that are neighboring to each other. seqFISH-detected multigene expression profiles are used together with the graph topology to identify spatial domains. In contrast, k-means and other clustering methods do not utilize spatial information and therefore the results are expected to be less coherent (illustrated in the dashed box). b. An intuitive illustration of the basic principles in a HMRF model. For a hypothetical cell (indicated by the question mark), its spatial domain assignment is inferred from combining information from gene expression (xi) and neighborhood configuration (cNi). The color of each node represents cell’s expression and the number inside each node is domain number. In this hypothetical example, combining such information results the cell being assigned to domain 1, instead of domain 3 (see Methods). c. HMRF identifies spatial domain configuration in the mouse visual cortex region. Distinct domains reveal a resemblance to layer organization of cortex. Naming of domains: I1a, I1b, I2, I3 are inner domains distributed in the inner layers. O1-O4 are outer domains. IS is inner scattered state. These domains are associated with cell morphological features such as distinct cell shape differences in outer layer domains. Cell shape information is obtained from segmentation of cells from images (see Methods). For HMRF, 1,000 initial centroids were used and the best centroid was selected to initiate HMRF. HMRF clustering was repeated two more times with similar results. d. General domain signatures that are shared between cells within domains. P-values signify two-sided Welch’s t-tests with P-values adjusted for multiple comparisons. Genes with significant P-values are shown. All domains are compared: O2 (n=109 cells), I1a (n=389), O4 (n=120), I1b (n=79), O1 (n=135), I2 (n=117), I3 (n=205), O3 (n=270), and IS (n=173).
Figure 3:
Figure 3:
HMRF analysis identified domain associated heterogeneity within glutamatergic cells. a. Three major sources of variations in glutamatergic neurons (n=859). Glutamatergic neurons are distributed across 9 domains with 79, 187, 88, 58, 93, 60, 73, 129, 92 cells in O2, I1a, O4, I1b, O1, I2, I3, O3, and IS domains. (Top): cell type specific signals Gda and Tbr1. (Middle): general domain signatures as in Fig 2d, summarized into metagenes’ expression. (Bottom): glutamatergic restricted domain signatures, found by comparing glutamatergic cells across domains and removing signatures that are general domain signatures. Signature genes were obtained by two-sided Welch’s t-tests with P-values adjusted for multiple comparisons. b. Snapshots of single cells. Each row is a snapshot of cells at the boundary of two layers. Each of two columns is a type of annotation: (left column) cell type, (right column) HMRF domains. Cell type is incapable of explaining layer-to-layer morphological variations: e.g. glutamatergic cells (orange) is present in all layers yet morphological differences exist within glutamatergic cells. HMRF domains better capture the boundary of two layers in each case, in that the domains can separate distinct morphologies. A systematic comparison is shown in Supplementary Fig 12. Also related to Supplementary Fig 11.
Figure 4.
Figure 4.
Reanalysis of single-cell RNAseq data (from Tasic et al) with domain signatures summarized into metagenes. a. t-SNE plot shows how the 812 glutamatergic cells from Tasic et al cluster according to expanded domain signatures aggregated as metagenes (shown in (b)). Colors indicate k-means clusters (k=9). Each cluster is annotated by its enriched metagene expression. Nine annotated glutamatergic metagene clusters were identified in Tasic et al: O2 (n=132 cells), I1a (n=98), O4 (n=92), I1b (n=131), O1 (n=84), I2 (n=22), I3 (n=97), O3 (n=100), and IS (n=56). b. Binarized metagene expression profiles for the glutamatergic cells. Red: population that highly expresses the metagene. c. Spatial clusters defined according to metagenes are enriched in manual layer dissection annotations. Column: layer annotation information obtained from microdissection, with L1-L2/3 (n=48 cells), L4 (n=202), L5 (n=116), L6 (n=12), L6a (n=87), and L6b (n=33). Row: metagene based cell clusters. P-values signify hypergeometric P-values of cell overlaps. d. Inferred spatial clusters of glutamatergic neurons are enriched in distinct GO biological processes. P-values signify hypergeometric P-values of gene overlaps, between differentially expressed genes (n=500) of each metagene cluster and Gene Ontology gene sets (variable sizes). P-values were adjusted for multiple comparisons.
Figure 5:
Figure 5:
Spatially dependent astrocyte variation revealed by HMRF. Neighborhood cell type composition for the 48 astrocyte cells (columns). Cells are ordered by HMRF domain annotations. The heatmap shows single cell expression of astrocytes clustered by domain-specific genes. Blue-box highlights the common signatures expressed in each domain’s astrocyte population. Identified astrocyte subpopulations are O2 (n=5), I1a (n=9), O1 (n=5), I3 (n=16), and O3 (n=13).

References

    1. Quail DFD & Joyce JJA Microenvironmental regulation of tumor progression and metastasis. Nat. Med. 19, 1423–1437 (2013). - PMC - PubMed
    1. Riquelme PA, Drapeau E & Doetsch F Brain micro-ecologies: neural stem cell niches in the adult mammalian brain. Philos. Trans. R. Soc. London B Biol. Sci. 363, (2008). - PMC - PubMed
    1. Swain PS, Elowitz MB & Siggia ED Intrinsic and extrinsic contributions to stochasticity in gene expression. Proc. Natl. Acad. Sci. 99, 12795–12800 (2002). - PMC - PubMed
    1. Tirosh I et al. Dissecting the multicellular ecosystem of metastatic melanoma by single-cell RNA-seq. Science 352, 189–96 (2016). - PMC - PubMed
    1. Zhang J & Li L Stem cell niche: Microenvironment and beyond. J. Biol. Chem. 283, 9499–9503 (2008). - PubMed

LinkOut - more resources