. 2019 Mar 1;28(5):718-735.
doi: 10.1093/hmg/ddy376.

Candidate-based screening via gene modulation in human neurons and astrocytes implicates FERMT2 in Aβ and TAU proteostasis

Affiliations

Candidate-based screening via gene modulation in human neurons and astrocytes implicates FERMT2 in Aβ and TAU proteostasis

Sarah E Sullivan et al. Hum Mol Genet. .

Abstract

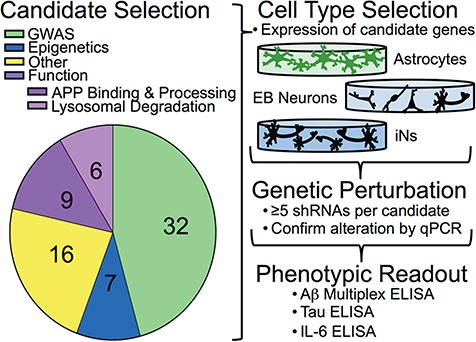
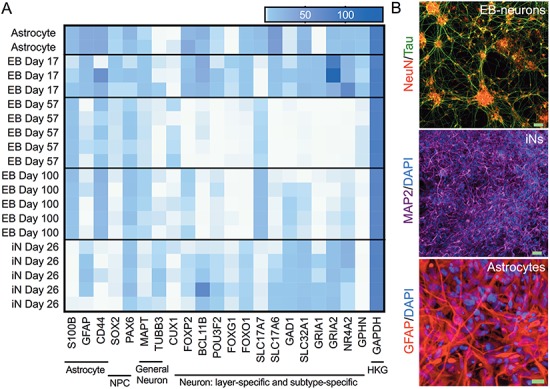
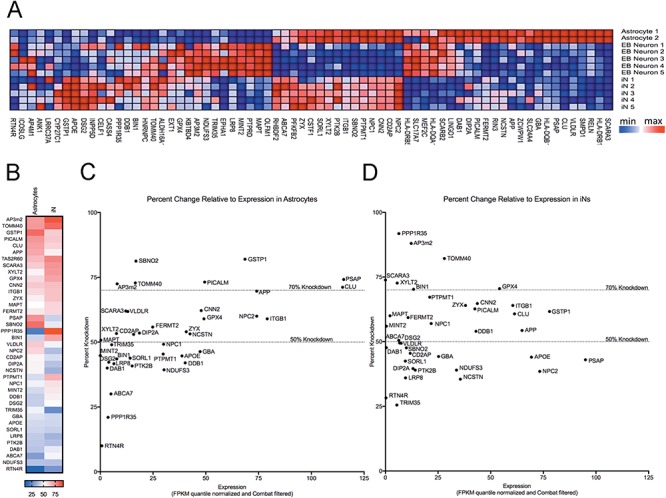
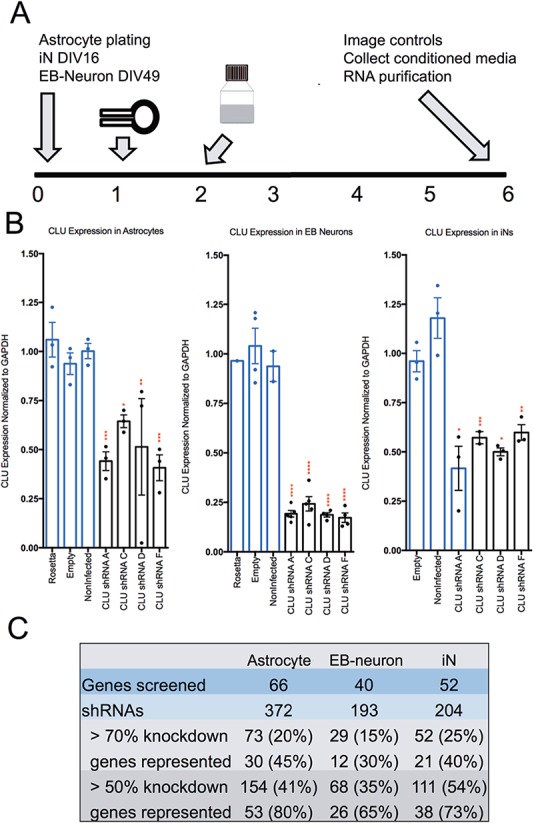
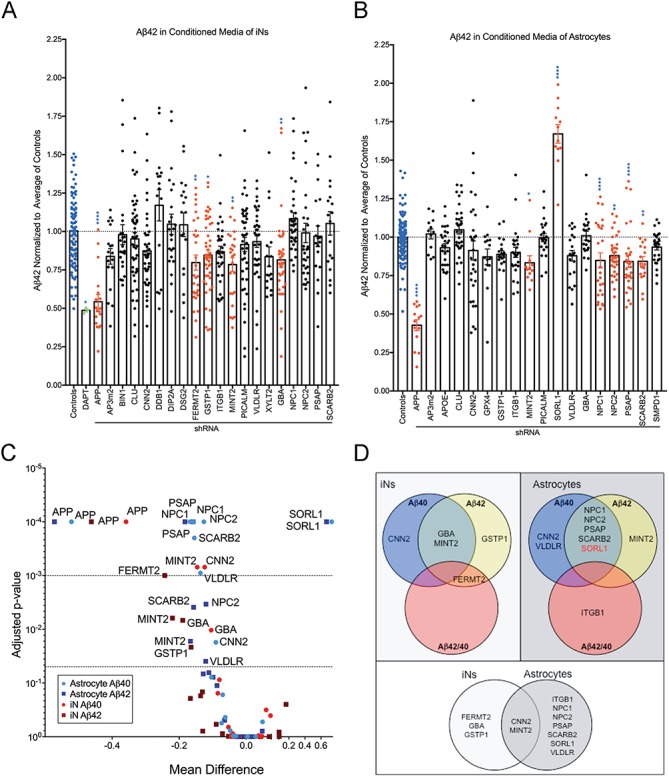
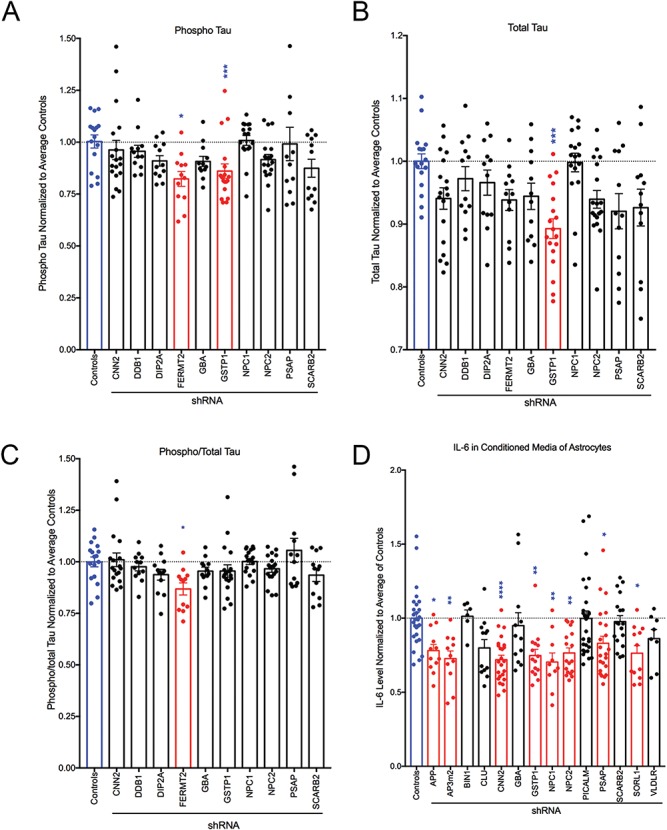
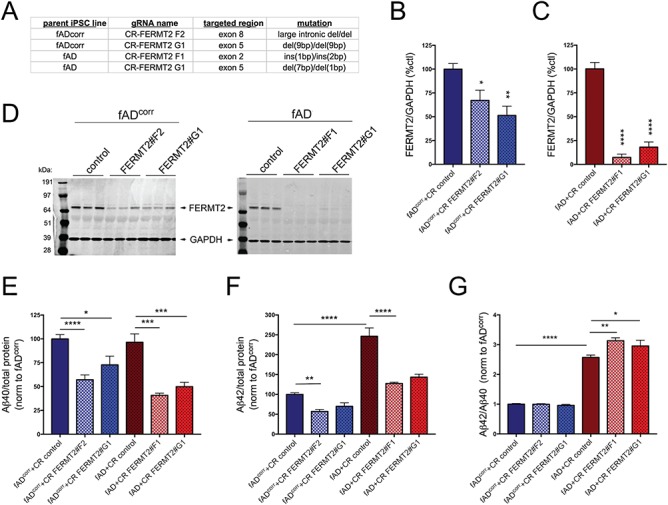
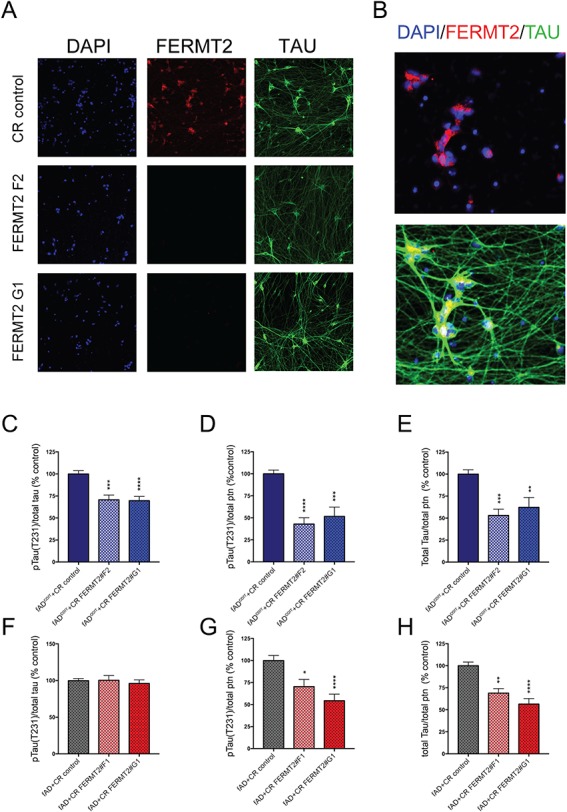
Large-scale 'omic' studies investigating the pathophysiological processes that lead to Alzheimer's disease (AD) dementia have identified an increasing number of susceptibility genes, many of which are poorly characterized and have not previously been implicated in AD. Here, we evaluated the utility of human induced pluripotent stem cell-derived neurons and astrocytes as tools to systematically test AD-relevant cellular phenotypes following perturbation of candidate genes identified by genome-wide studies. Lentiviral-mediated delivery of shRNAs was used to modulate expression of 66 genes in astrocytes and 52 genes in induced neurons. Five genes (CNN2, GBA, GSTP1, MINT2 and FERMT2) in neurons and nine genes (CNN2, ITGB1, MINT2, SORL1, VLDLR, NPC1, NPC2, PSAP and SCARB2) in astrocytes significantly altered extracellular amyloid-β (Aβ) levels. Knockdown of AP3M2, CNN2, GSTP1, NPC1, NPC2, PSAP and SORL1 reduced interleukin-6 levels in astrocytes. Only knockdown of FERMT2 led to a reduction in the proportion of TAU that is phosphorylated. Further, CRISPR-Cas9 targeting of FERMT2 in both familial AD (fAD) and fAD-corrected human neurons validated the findings of reduced extracellular Aβ. Interestingly, FERMT2 reduction had no effect on the Aβ42:40 ratio in corrected neurons and a reduction of phospho-tau, but resulted in an elevation in Aβ42:40 ratio and no reduction in phospho-tau in fAD neurons. Taken together, this study has prioritized 15 genes as being involved in contributing to Aβ accumulation, phosphorylation of tau and/or cytokine secretion, and, as illustrated with FERMT2, it sets the stage for further cell-type-specific dissection of the role of these genes in AD.


Figures

Figure 1
Figure 1
Screening strategy. Candidate genes were selected based either on their identification through large data studies (GWAS or epigenetics) or their functional role in known AD-related processes. Other genes were selected based on their relation to previously selected genes (Supplementary Material, Table S1). The appropriate cell type in which to screen candidates was determined based on the expression of candidates in each cell type. Genetic perturbation of candidates was performed by screening multiple shRNAs per gene, and knockdown was evaluated by qPCR (Supplementary Material, Tables S1 and S2). Those lentiviruses with which robust reduction of gene expression resulted were used to evaluate the effect of gene knockdown on AD-related phenotypic readouts.
Figure 2
Figure 2
Cell type characterization. (A) Purified RNA of cell lysates collected from astrocytes (day 6), EB-neurons at 3 differentiation time points (days 17, 57 and 100) and iNs (day 26) were analyzed by RNAseq. Genes were selected that mark subsets of neuronal and glial cells and a heat map was created using Prism. NPC, neural progenitor cell; HKG, housekeeping gene. (B) Representative images of immunocytochemistry of each cell culture type with markers for neuron (NeuN and MAP2) and astrocytes (GFAP). Scale bars: EB-neurons and iNs, 50 μm; astrocytes, 20 μm.
Figure 3
Figure 3
Relative expression of target genes in the three cell culture experimental systems. Cell lysates were collected and pooled from 3 wells of a 96-well plate for each sample. Astrocytes were collected 6 days after plating, while EB-derived neurons and iNs were collected at DIV 57 and DIV 26, respectively. RNA was purified and analyzed by RNAseq. Quantile normalization method was used on FPKM values followed by Combat to remove experimental batch effects. Heat maps were created using Gene Pattern (Broad Institute). Samples were row normalized (A). (B) In this heat map, for each tested gene (rows) in astrocytes (left column) and iNs (right column), we report the highest average knockdown achieved by an shRNA construct. A color key is provided at the bottom of the panel. In (CD), each dot represents one gene and we plot the results for the shRNA construct with the highest average knockdown (y-axis) for that gene relative to the gene's level of expression (x-axis) in astrocytes (C) and iNs (D).
Figure 4
Figure 4
Overview of shRNA screen of AD-related candidate genes. (A) Schematic representation of lentiviral shRNA transduction protocol. On day 1, lentivirus packaged shRNA is applied in fresh media. The following day (day 2) media is removed and replaced. On day 6, GFP-transduced cells are imaged to examine morphology and transduction efficiency, conditioned media collected and RNA purified from all wells. (B) Representative graphs of data collected from each cell type from a single experiment. Relative expression of CLU, the gene encoding clusterin, in human primary astrocytes (left), EB-derived neurons (middle) and iNs (right) following transduction of lentivirus encoding shRNAs against CLU as measured by qPCR. Results are normalized to GAPDH and presented as percent change from averaged controls normalized to 1. Each dot shows data from one well. Statistical analysis performed by ANOVA. *P < 0.05, **P < 0.005, ***P < 0.0005, ****P < 0.0001. (C) Summary of numbers of genes and shRNAs screened in astrocytes, EB-derived neurons and iNs.
Figure 5
Figure 5
Knockdown of selected gene targets significantly reduces extracellular Aβ42 concentration targeted astrocytes and iNs. Conditioned media from shRNA targeted iNs (A) or astrocytes (B) were analyzed by Aβ triplex ELISA. Results were normalized to the average of control conditions for each experiment before multiple experiments were combined. Each dot represents data from an independent well. Blue bars highlight controls; green bars highlight treatment with a gamma-secretase inhibitor (DAPT); red bars highlight conditions reaching statistical significance. Shown is the mean ± SEM. *P < 0.05, **P < 0.005, ***P < 0.0005, ****P < 0.0001 by ordinary one-way ANOVA. (C) The adjusted P-value plotted as a function of the mean difference for Aβ40 and Aβ42 in astrocytes and iNs. (D) Summary of Aβ phenotypes observed in astrocytes and iNs. Only SORL1 knockdown (red) showed an increase, all others a decrease.
Figure 6
Figure 6
Knockdown of selected gene targets alters phosphorylated tau and IL-6 levels. (A–C) Lysates collected from iNs targeted by shRNA were analyzed by phospho Thr231/total tau multiplex ELISA (MSD). Results were normalized to the average of controls for each experiment and combined across experiments. (D). IL-6 levels were measured in conditioned media from astrocyte cultures via ELISA (MSD). Results were normalized to average of controls for each experiment and combined across experiments. For all graphs, blue bars indicate controls and red bars indicate conditions in which significant changes were detected. Each dot represents data from an independent well. Shown is the mean ± SEM. *P < 0.05, **P < 0.005, ***P < 0.0005, ****P < 0.0001 by Kruskal–Wallis test with Dunn's multiple comparisons test.
Figure 7
Figure 7
CRISPR/Cas9 targeting of FERMT2 in fAD and fADcorr iPSC lines confirms that lowering FERMT2 levels in human neurons results in lower extracellular Aβ levels. The FERMT2 locus was targeted in iPSC lines using gRNAs recognizing the exons listed, and the resultant indel mutations introduced are shown (A). Following targeting, iPSC lines were differentiated to neuronal fates and protein lysates collected at day 21 of differentiation. Example western blots and quantifications are shown for fADcorr iNs (B, D) and fAD iNs (C, D). ‘CR control’ refers to iPSC subclones that underwent a mock targeting, whereby Cas9 and empty gRNA vector were transfected, and monoclonal subclones isolated and analyzed in parallel to subclones whereby FERMT2 was targeted. At day 21 of differentiation, 48 h conditioned media were collected and cells lysed. Aβ40 and 42 levels were measured via multiplexed ELISA (MSD), normalized to total protein levels in the cell lysate and then normalized to fADcorr CR control for each differentiation (E, F). Data in (G) shows Aβ42:40 ratios for each condition. Quantifications for B and C are from 2–3 independent differentiations, for fAD n = 9, 6, 9; fADcorrn = 6, 5, 6. One-way ANOVA with Holm–Sidak multiple comparisons tests performed; *P < 0.05; **P < 0.01; ****P < 0.0001. For E–G, in order from left to right, n = 9, 9, 9, 6, 6, 6. One-way ANOVA with Holm–Sidak multiple comparisons tests performed; *P < 0.05, **P < 0.01, ***P < 0.0005, ****P < 0.0001.
Figure 8
Figure 8
FERMT2 targeting results in lower phospho- to total-TAU levels in fADcorr but not fAD iNs. FERMT2 targeted iPSC lines were differentiated to iN fates. At day 21 of differentiation, cells were either fixed and immunostained (AB) or else lysed and TAU analyzed by ELISA (C–H). (A, B) Example immunocytochemistry for FERMT2 and TAU in fADcorr iNs. (A) FERMT2 targeting lowers FERMT2 immunostaining. (B) Magnified view of immunostaining of CR control to show subcellular localization of FERMT2 in untargeted human neurons. (C–H) Data from a multiplexed ELISA (MSD) showing pTAU(Thr231) and total TAU are shown for fADcorr (C–E) and fAD (F–H) iNs. Quantification is from 3 independent differentiations, for (C–E) n = 15, 15, 15 and for (F–H) n = 15,8,15. One-way ANOVA with Dunnett's multiple comparisons tests performed; *P < 0.05, **P < 0.01, ***P < 0.0005, ****P < 0.0001.
Figure 9
Figure 9
FERMT2 expression and association with LOAD (AC) Postmortem human cerebral cortex from a non-AD subject was embedded, paraffin sectioned and immunostained for FERMT2, NEUN, ALDH1 and IBA1, with DAPI counterstaining nuclei. (DF) Regional genetic association plots for FERMT2 and LOAD (D), amyloid burden (E) and VGF protein levels (F) in the postmortem brain. In these regional plots, association results are presented for all SNPs (dots) within the FERMT2 region of the genome. The lead SNP (rs117646236; chr14:53401449) in this region is shown in purple, and other SNPs are colored based upon the extent of linkage disequilibrium with the lead SNP, following the color key in the upper right panel. The x-axis denotes the physical position of the SNP, and the y-axis reports −log10(P-value) for each SNP. The blue line denotes the recombination rate in this region in European participants from the 1000 Genomes Project. The location of the gene is present at the bottom of each panel. (G, H) VGF expression was measured via qRT-PCR in human iNs with and without FERMT2 targeting. Quantification is from 3 independent differentiations: (G), n = 8, 9, 8; (H), n = 9, 6, 9. One-way ANOVA with Dunnett's multiple comparisons tests performed; *P < 0.05, **P < 0.01, ***P < 0.0005, ****P < 0.0001. (I) Publicly available RNA-seq analyses (Mayo Clinic Brain Bank) from post-mortem human temporal cortex (Temp Cx) and cerebellum (Cb) is shown for FERMT2. n = 275 and 276 for Temp Cx and Cb, respectively. One-way ANOVA with Dunnett's multiple comparisons tests performed; ****P < 0.0001.

Similar articles

Cited by

References

    1. Selkoe D.J. and Hardy J. (2016) The amyloid hypothesis of Alzheimer's disease at 25 years. EMBO Mol. Med., 8, 595–608. - PMC - PubMed
    1. Sullivan S.E. and Young-Pearse T.L. (2017) Induced pluripotent stem cells as a discovery tool for Alzheimer's disease. Brain Res., 1656, 98–106. - PMC - PubMed
    1. Zhang Y., Pak C., Han Y., Ahlenius H., Zhang Z., Chanda S., Marro S., Patzke C., Acuna C., Covy J. et al. (2013) Rapid single-step induction of functional neurons from human pluripotent stem cells. Neuron, 78, 785–798. - PMC - PubMed
    1. Bertram L., McQueen M.B., Mullin K., Blacker D. and Tanzi R.E. (2007) Systematic meta-analyses of Alzheimer's disease genetic association studies: the AlzGene database. Nat. Genet., 39, 17–23. - PubMed
    1. Lambert J.C., Ibrahim-Verbaas C.A., Harold D., Naj A.C., Sims R., Bellenguez C., DeStafano A.L., Bis J.C., Beecham G.W., Grenier-Boley B. et al. (2013) Meta-analysis of 74,046 individuals identifies 11 new susceptibility loci for Alzheimer's disease. Nat. Genet., 45, 1452–1458. - PMC - PubMed

Publication types