

Cough-aerosol cultures of Mycobacterium tuberculosis in the prediction of outcomes after exposure. A household contact study in Brazil
- PMID: 30372480
- PMCID: PMC6205616
- DOI: 10.1371/journal.pone.0206384
Cough-aerosol cultures of Mycobacterium tuberculosis in the prediction of outcomes after exposure. A household contact study in Brazil
Abstract
Background: Mycobacterium tuberculosis cultures of cough-generated aerosols from patients with pulmonary tuberculosis (TB) are a quantitative method to measure infectiousness and to predict secondary outcomes in exposed contacts. However, their reproducibility has not been established.
Objective: To evaluate the predictive value of colony-forming units (CFU) of M. tuberculosis in cough aerosols on secondary infection and disease in household contacts in Brazil.
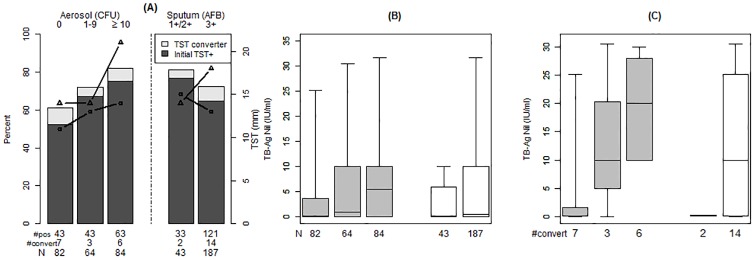
Methods: Adult sputum smear+ and culture+ pulmonary TB cases underwent a standard evaluation and were categorized according to aerosol CFU. We evaluated household contacts for infection at baseline and at 8 weeks with TST and IGRA, and secondary disease.
Results: We enrolled 48 index TB cases; 40% had negative aerosols, 27% low aerosols (<10 CFU) and 33% high aerosols (≥10 CFU). Of their 230 contacts, the proportion with a TST ≥10 mm at 8 weeks was 59%, 65% and 75%, respectively (p = 0.34). Contacts of high aerosol cases had greater IGRA readouts (median 4.6 IU/mL, IQR 0.02-10) when compared to those with low (0.8, 0.2-10) or no aerosol (0.1, 0-3.7; p = 0.08). IGRA readouts in TST converters of high aerosol cases (median 20 IU/mL, IQR 10-24) were larger than those from aerosol-negative (0.13, 0.04-3; p = o.o2). 8/9 (89%) culture+ secondary TB cases occurred in contacts of aerosol+ cases.
Conclusion: Aerosol CFU predicts quantitatively IGRA readouts among household contacts of smear positive TB cases. Our results strengthen the argument of using cough aerosols to guide targeted preventive treatment strategies, a necessary component of current TB elimination projections.
Conflict of interest statement
One of our co-authors, Dr. Jones-López, is a co-founder and shareholder of a small startup company created in 2013 to develop and commercialize a molecular assay for tuberculosis diagnosis. This does not alter our adherence to PLOS ONE policies on sharing data and materials. All other authors declare that no competing interests exist.
Figures
References
-
- Riley RL, Mills CC, O'Grady F, Sultan LU, Wittstadt F, Shipvuri DN. Infectiousness of air from a tuberculosis ward. Ultraviolet irradiation of infected air: comparative infectiousness of different patients. Am Rev Respir Dis. 1962. April;85:511–25. . - PubMed
Publication types
MeSH terms
Substances
Grants and funding
LinkOut - more resources
Full Text Sources
Medical
