. 2019 Feb;37(2):270-283.
doi: 10.1002/stem.2937. Epub 2018 Nov 17.

LncRNA-OG Promotes the Osteogenic Differentiation of Bone Marrow-Derived Mesenchymal Stem Cells Under the Regulation of hnRNPK

Affiliations

LncRNA-OG Promotes the Osteogenic Differentiation of Bone Marrow-Derived Mesenchymal Stem Cells Under the Regulation of hnRNPK

Su'an Tang et al. Stem Cells. 2019 Feb.

Abstract

Bone marrow-derived mesenchymal stem cells (BM-MSCs) are the main source of osteoblasts in vivo and are widely used in stem cell therapy. Previously, we analyzed long noncoding RNA (lncRNA) expression profiles during BM-MSC osteogenesis, and further investigation is needed to elucidate how lncRNAs regulate BM-MSC osteogenesis. Herein, we used customized microarrays to determine lncRNA expression profiles in BM-MSCs on days 0 and 10 of osteogenic differentiation. In addition, we identified a novel osteogenesis-associated lncRNA (lncRNA-OG) that is upregulated during this process. Functional assays showed that lncRNA-OG significantly promotes BM-MSC osteogenesis. Mechanistically, lncRNA-OG interacts with heterogeneous nuclear ribonucleoprotein K (hnRNPK) protein to regulate bone morphogenetic protein signaling pathway activation. Surprisingly, hnRNPK positively regulates lncRNA-OG transcriptional activity by promoting H3K27 acetylation of the lncRNA-OG promoter. Therefore, our study revealed a novel lncRNA with a positive function on BM-MSC osteogenic differentiation and proposed a new interaction between hnRNPK and lncRNA. Stem Cells 2018 Stem Cells 2019;37:270-283.

Keywords: Heterogeneous nuclear ribonucleoprotein K; Long noncoding RNA; Mesenchymal stem cells; Osteogenic differentiation.


Conflict of interest statement

The authors indicated no potential conflicts of interest.

Figures

Figure 1
Figure 1
Phenotype identification and trilineage differentiation potential of bone marrow‐derived mesenchymal stem cells (BM‐MSCs). (A): BM‐MSCs were negative for CD14, CD45, and HLA‐DR expression and positive for CD29, CD44, and CD105 expression. (B): BM‐MSCs were induced to undergo osteogenic differentiation, adipogenic differentiation, and chondrogenic differentiation. Scale bars in undifferentiation, osteogenesis, and chondrogenesis, 250 μm. Scale bar in adipogenesis, 625 μm.
Figure 2
Figure 2
Osteogenesis‐associated long noncoding RNA (lncRNA‐OG) is highly expressed during bone marrow‐derived mesenchymal stem cell (BM‐MSC) osteogenesis. (A): Geometric mean‐centered, hierarchical clustering heat map from microarray data. The 1,050 differentially (≥ 2‐fold) expressed (two‐tailed, paired Student's t test, and false discovery rate < 0.2) annotated noncoding RNAs (p < .05) on days 0 and 10 of osteogenic differentiation. Microarray data are from three independent biological replicates. (B): Relative expression of lncRNA‐OG at various time points during BM‐MSC osteogenic differentiation, as determined by quantitative real‐time polymerase chain reaction (qRT‐PCR). GAPDH was used for normalization. (C): Schematic annotation of the lncRNA‐OG genomic locus on chromosome 12. Purple rectangles represent exons (upper panel). Sequence conservation was analyzed by Phylop software (lower panel). (D): LncRNA‐OG intracellular localization was visualized in BM‐MSCs by RNA‐fluorescence in situ hybridization assays. Representative images of lncRNA‐OG on days 0 and 10 of osteogenesis are shown. DAPI, 4′,6‐diamidino‐2‐phenylindole. Probes, lncRNA‐OG. Scale bar, 20 μm. (E): Percentages of nuclear and cytoplasmic RNA, as measured by qRT‐PCR after subcellular MSC fractionation. GAPDH and ACTB RNA served as positive controls for cytoplasmic gene expression. U6 and MALAT1 RNA served as positive controls for nuclear gene expression. Data are presented as the mean ± SD. *, p < .05; **, p < .01 (n = 3 independent experiments). Data represent at least three independent experiments. See also Supporting Information Figure S1.
Figure 3
Figure 3
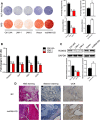
Osteogenesis‐associated long noncoding RNA (lncRNA‐OG) promotes the osteogenic differentiation of bone marrow‐derived mesenchymal stem cells (BM‐MSCs). (A): Left: alkaline phosphatase (ALP) staining on day 7 (upper panel), alizarin red (ARS) staining on day 14 after osteogenic induction (lower panel). Right: ALP activity was determined as units per gram of protein per 15 minutes. ARS staining was quantified as the absorbance at 562 nm. (B): Relative mRNA levels of RUNX2 and ALP detected by quantitative real‐time polymerase chain reaction (qRT‐PCR) on day 7 of osteogenic differentiation. Relative mRNA levels of OSX and OCN detected by qRT‐PCR on day 10 of osteogenic differentiation. Data were normalized to GAPDH expression. (C): Western blotting analysis of RUNX2 protein levels on day 7 of osteogenic induction. GAPDH was used as the internal control (upper panel). Lower, quantification of band intensities (lower panel). (D): H&E staining, Masson's trichrome staining, and immunohistochemical staining of OCN in lncRNA‐OG and NC groups. Scale bars, 100 μm. Data are presented as the mean ± SD. *, p < .05; **, p < .01 (n = 3 independent experiments). See also Supporting Information Figure S2.
Figure 4
Figure 4
Osteogenesis‐associated long noncoding RNA (lncRNA‐OG) interacts with hnRNPK in the nuclei of bone marrow‐derived mesenchymal stem cells (BM‐MSCs). (A): Silver staining of RNA pull‐down precipitates. Biotin‐RNA pull‐down assays were performed with MSC nuclear extracts using full‐length lncRNA‐OG transcripts and lncRNA‐OG reverse‐complement transcripts (antisense). Pull‐down assays were followed by mass spectrometry. (B): Western blotting analysis of the specific association between hnRNPK and lncRNA‐OG. β‐Actin was used as a control. (C): The interaction between lncRNA‐OG and hnRNPK was verified by RIP assays. (D): Colocalization of lncRNA‐OG and hnRNPK in MSC nuclei. Scale bars, 20 μm. (E): In vitro‐transcribed biotin‐labeled RNA (top panel); associated hnRNPK was detected by Western blotting analysis (middle panel); schematic diagram of full‐length lncRNA‐OG and truncated fragments (bottom panel). (F): Exon 4 (nucleotides 645–878) of lncRNA‐OG was predicted to have a stable stem‐loop structure. Prediction of the exon 4 region of the lncRNA‐OG structure and its antisense sequence was based on minimum free energy and the partition function. The color scale shows the confidence of the prediction for each base, with shades of red indicating strong confidence (http://rna.tbi.univie.ac.at). Data are shown as the mean ± SD. **, p < .01 (n = 3 independent experiments). See also Supporting Information Figure S3.
Figure 5
Figure 5
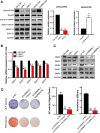
Osteogenesis‐associated long noncoding RNA (lncRNA‐OG) regulates the expression of bone morphogenetic protein (BMP) family proteins by interacting with hnRNPK. (A): Expression analysis of BMP signaling, β‐catenin/WNT signaling and ERK1/2/MAPK signaling following lncRNA‐OG knockdown and overexpression in bone marrow‐derived mesenchymal stem cells (BM‐MSCs) by Western blotting. GAPDH was used as the internal control (left panel). Quantification of pSmad1/5/8 band intensities (right panel). (B): Related mRNA levels of BMP2, BMP4, BMP6, BMP7, and BMP9 after lncRNA‐OG knockdown on day 7 of osteogenic differentiation. Data were normalized to GAPDH. (C): Expression of BMP family proteins following lncRNA‐OG and hnRNPK knockdown respectively in BM‐MSCs by Western blotting. GAPDH was used as the internal control. (D): Left: alkaline phosphatase (ALP) staining on day 7 (upper panel), alizarin red (ARS) staining on day 14 after osteogenic induction (lower panel). Right: ALP activity was determined as units per gram of protein per 15 minutes. ARS staining was quantified as the absorbance at 562 nm. Data are presented as the mean ± SD. *, p < .05; **, p < .01 (n = 3 independent experiments). See also Supporting Information Figure S4.
Figure 6
Figure 6
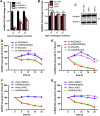
HnRNPK promotes osteogenesis‐associated long noncoding RNA (lncRNA‐OG) transcription. (A): Related expression of lncRNA‐OG after hnRNPK knockdown on days 3, 7, and 10 of osteogenic differentiation. (B): Related mRNA levels of hnRNPK after lncRNA‐OG knockdown on days 3, 7, and 10 of osteogenic differentiation. (C): Western blotting analysis of hnRNPK protein levels on day 3 of osteogenic differentiation after lncRNA‐OG knockdown. (D–G): Related expression of GAPDH and lncRNA‐OG transcripts after blocking new RNA synthesis using actinomycin D (ActD) or dimethylsulfoxide (negative control) and normalizing to 18S rRNA expression. (D) and (E) show the group with hnRNPK silenced. (F) and (G) show the group with hnRNPK overexpression. Data are presented as the mean ± SD. Ns > 0.05; *, p < .05; **, p < .01 (n = 3 independent experiments).
Figure 7
Figure 7
HnRNPK promotes osteogenesis‐associated long noncoding RNA (lncRNA‐OG) transcriptional activity by increasing H3K27ac. (A): Schematic diagram of the lncRNA‐OG promoter region showing strong indications of histone H3 acetylation. Histone modification data were retrieved from the ENCODE collection. Six pairs of primers were designed for the promoter region. (B): Left: HnRNPK binding to the lncRNA‐OG promoter region were assessed by ChIP using primers for exon 4 on days 0 and 10 of osteogenesis. Right: ChIP assay of H3K27ac in the lncRNA‐OG promoter region using primers for exon 4 on days 0 and 10 of osteogenesis. (C): H3K27ac enrichment in the lncRNA‐OG promoter region during osteogenic differentiation by ChIP‐qPCR. ChIP‐qPCR assay of H3K27ac in the lncRNA‐OG promoter region using six pairs of primers after hnRNPK knockdown (D) and hnRNPK overexpression (E). Data are presented as the mean ± SD. *, p < .05 (n = 3 independent experiments).

References

    1. Olsen BR, Reginato AM, Wang W. Bone development. Annu Rev Cell Dev Biol 2000;16:191–220. - PubMed
    1. Kronenberg HM. Developmental regulation of the growth plate. Nature 2003;423:332–336. - PubMed
    1. Grayson WL, Bunnell BA, Martin E et al. Stromal cells and stem cells in clinical bone regeneration. Nat Rev Endocrinol 2015;11:140–150. - PMC - PubMed
    1. Xie Z, Wang P, Li Y et al. Imbalance between bone morphogenetic protein 2 and noggin induces abnormal osteogenic differentiation of mesenchymal stem cells in ankylosing spondylitis. Arthritis Rheumatol 2016;68:430–440. - PubMed
    1. Lian WS, Wu RW, Lee MS et al. Subchondral mesenchymal stem cells from osteoarthritic knees display high osteogenic differentiation capacity through microRNA‐29a regulation of HDAC4. J Mol Med 2017;95:1327–1340. - PubMed

Publication types

MeSH terms

Substances