The First Decade of Web-Based Sports Injury Surveillance: Descriptive Epidemiology of Injuries in US High School Girls' Soccer (2005-2006 Through 2013-2014) and National Collegiate Athletic Association Women's Soccer (2004-2005 Through 2013-2014)
- PMID: 30372637
- PMCID: PMC6208306
- DOI: 10.4085/1062-6050-156-17
The First Decade of Web-Based Sports Injury Surveillance: Descriptive Epidemiology of Injuries in US High School Girls' Soccer (2005-2006 Through 2013-2014) and National Collegiate Athletic Association Women's Soccer (2004-2005 Through 2013-2014)
Abstract
Context:: The advent of Web-based sports injury surveillance via programs such as the High School Reporting Information Online system and the National Collegiate Athletic Association Injury Surveillance Program has aided the acquisition of girls' and women's soccer injury data.
Objective:: To describe the epidemiology of injuries sustained in high school girls' soccer in the 2005-2006 through 2013-2014 academic years and collegiate women's soccer in the 2004-2005 through 2013-2014 academic years using Web-based sports injury surveillance.
Design:: Descriptive epidemiology study.
Setting:: Online injury surveillance from soccer teams in high school girls (annual average = 100) and collegiate women (annual average = 52).
Patients or other participants:: Female high school and collegiate soccer players who participated in practices or competitions during the 2004-2005 through 2013-2014 academic years.
Main outcome measure(s):: Athletic trainers collected time-loss (≥24 hours) injury and exposure data. Injury rates per 1000 athlete-exposures (AEs), injury rate ratios (IRRs) with 95% confidence intervals (CIs), injury proportions by body site, and diagnoses were calculated.
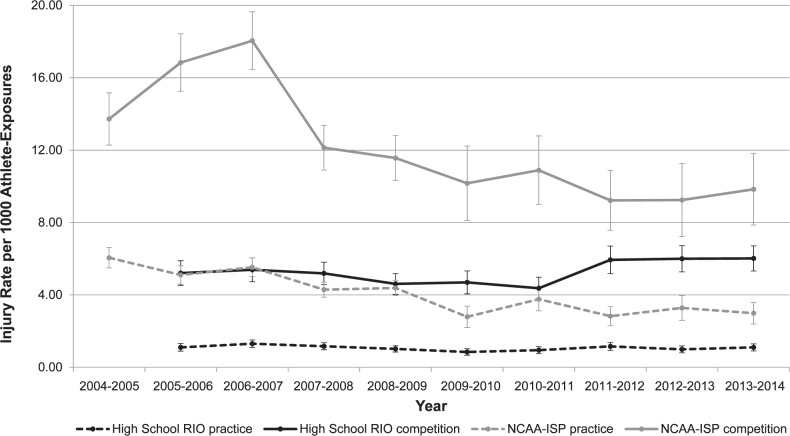
Results:: The High School Reporting Information Online system documented 3242 time-loss injuries during 1 393 753 AEs; the National Collegiate Athletic Association Injury Surveillance Program documented 5092 time-loss injuries during 772 048 AEs. Injury rates were higher in college than in high school (6.60 versus 2.33/1000 AEs; IRR = 2.84; 95% CI = 2.71, 2.96), and during competitions than during practices in high school (IRR = 4.88; 95% CI = 4.54, 5.26) and college (IRR = 2.93; 95% CI = 2.77, 3.10). Most injuries at both levels affected the lower extremity and were ligament sprains or muscle/tendon strains. Concussions accounted for 24.5% of competition injuries in high school but 14.6% of competition injuries in college. More than one-third of competition injuries to high school goalkeepers were concussions.
Conclusions:: Injury rates were higher in college versus high school and during competitions versus practices. These differences may be attributable to differences in reporting, activity intensity, and game-play skill level. The high incidence of lower extremity injuries and concussions in girls' and women's soccer, particularly concussions in high school goalkeepers, merits further exploration and identification of prevention strategies.
Keywords: concussions; female athletes; lower extremity injuries.
Figures
References
-
- Participation statistics (2016) National Federation of State High Schools Web site. 2018 http://www.nfhs.org/ParticipationStatics/ParticipationStatics.aspx/ Accessed February 27.
-
- Student-athlete participation: 1981–82—2014–15. National Collegiate Athletic Association Web site. 2018 http://www.ncaa.org/sites/default/files/Participation%20Rates%20Final.pdf Accessed February 27.
-
- Centers for Disease Control and Prevention. Sports-related injuries among high school athletes—United States, 2005–06 school year. MMWR Morb Mortal Wkly Rep. 2006;55(38):1037–1040. - PubMed
-
- Van Mechelen W, Hlobil H, Kemper HC. Incidence, severity, aetiology and prevention of sports injuries: a review of concepts. Sports Med. 1992;14(2):82–99. - PubMed
MeSH terms
Grants and funding
LinkOut - more resources
Full Text Sources
Medical