

Glia Maturation Factor and Mast Cell-Dependent Expression of Inflammatory Mediators and Proteinase Activated Receptor-2 in Neuroinflammation
- PMID: 30372685
- PMCID: PMC6334644
- DOI: 10.3233/JAD-180786
Glia Maturation Factor and Mast Cell-Dependent Expression of Inflammatory Mediators and Proteinase Activated Receptor-2 in Neuroinflammation
Abstract
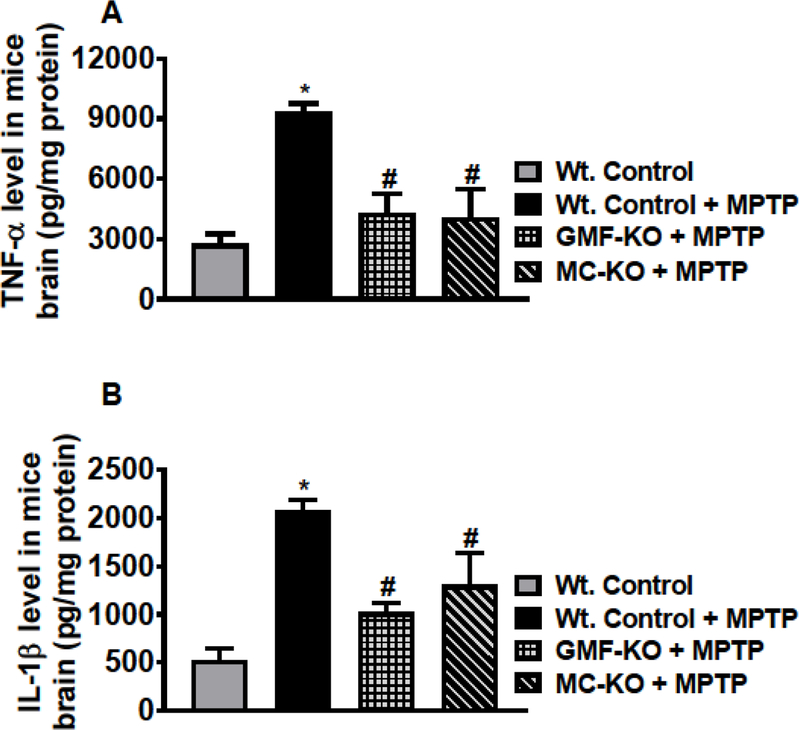
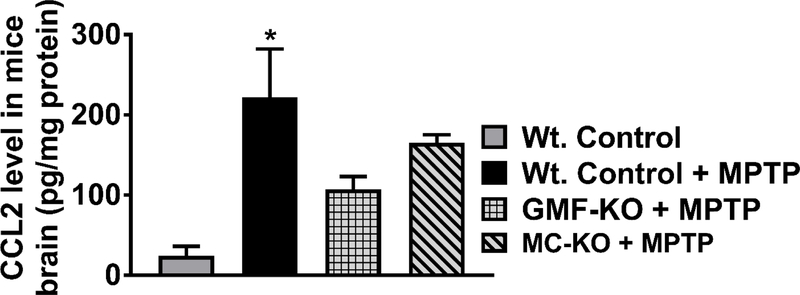
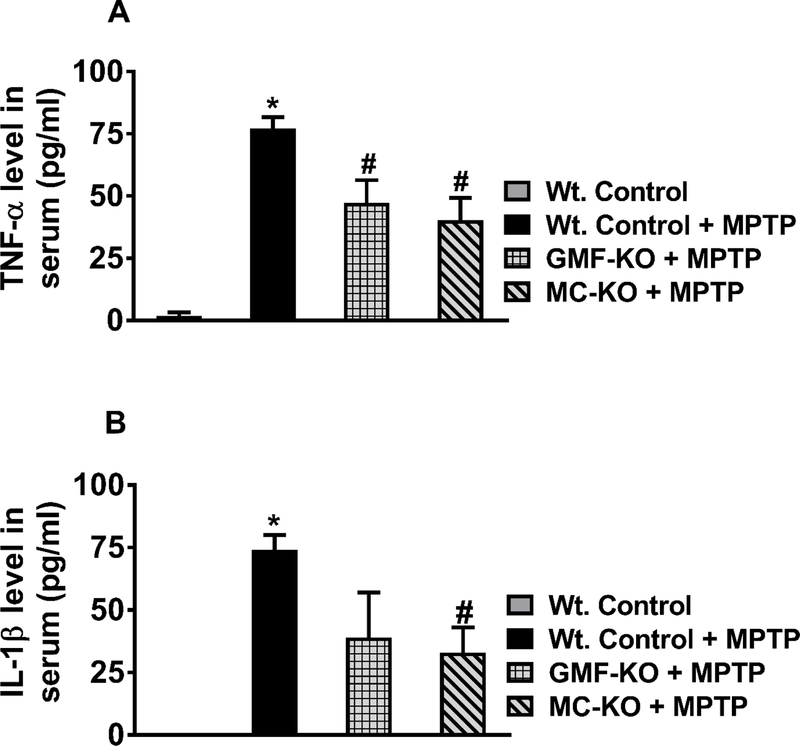
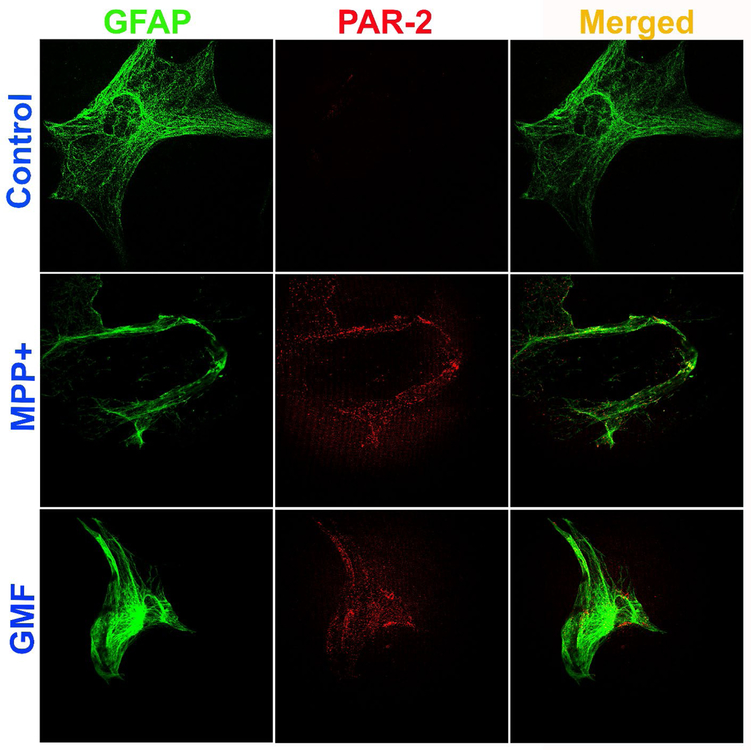
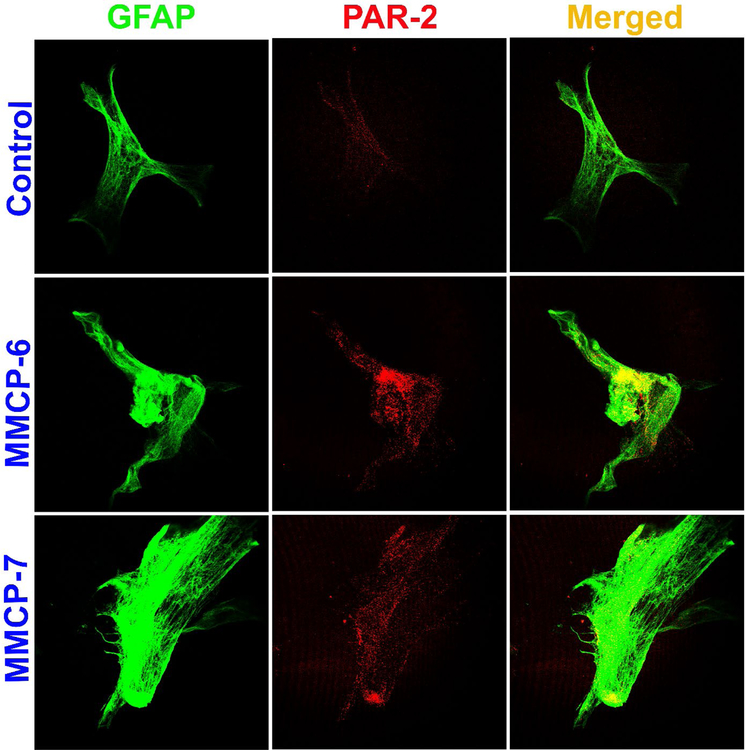
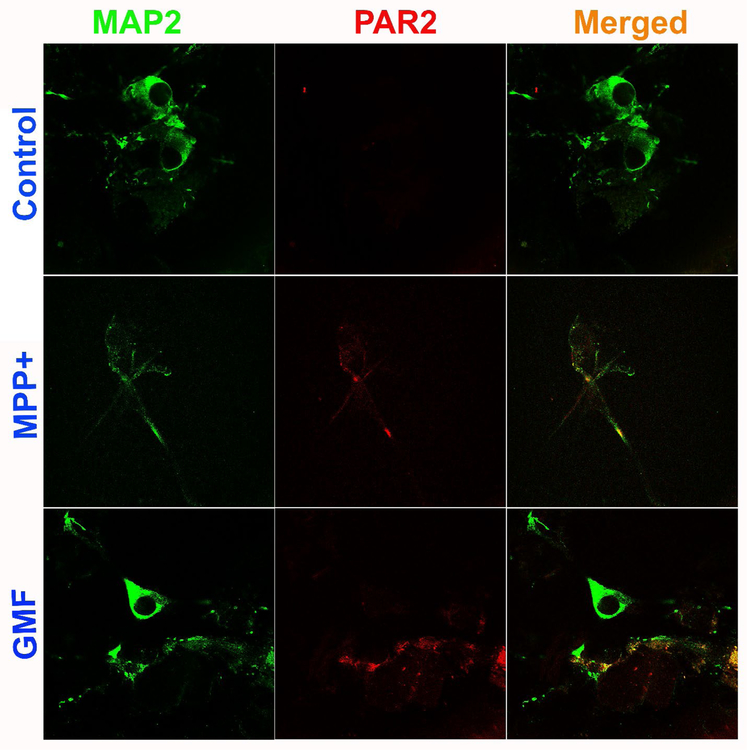
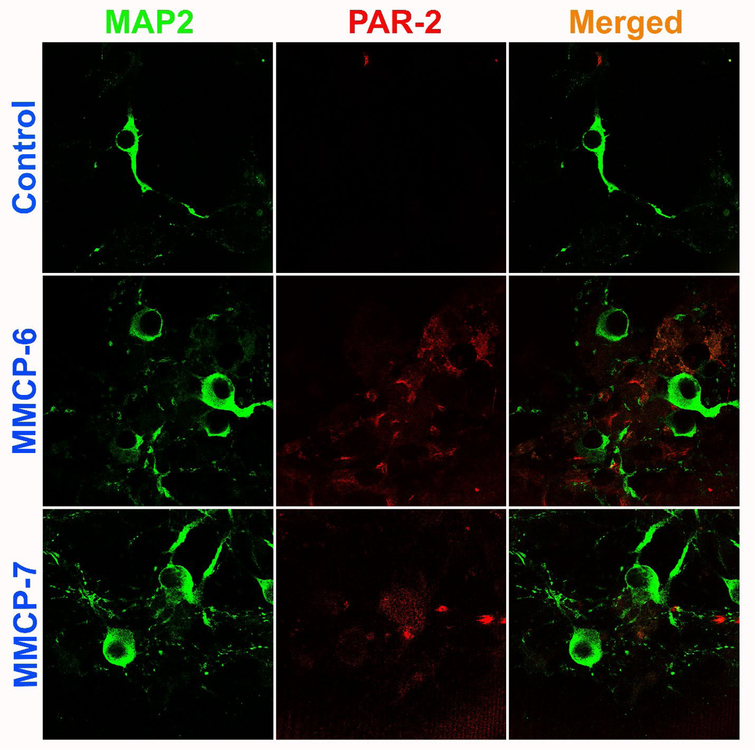
Parkinson's disease (PD) is characterized by the presence of inflammation-mediated dopaminergic neurodegeneration in the substantia nigra. Inflammatory mediators from activated microglia, astrocytes, neurons, T-cells and mast cells mediate neuroinflammation and neurodegeneration. Administration of neurotoxin 1-methyl-4-phenyl-1,2,3,6-tetrahydropyridine (MPTP)-induces PD like motor deficits in rodents. 1-methyl-4-phenylpyridinium (MPP+), a toxic metabolite of MPTP activates glial cells, neurons and mast cells to release neuroinflammatory mediators. Glia maturation factor (GMF), mast cells and proteinase activated receptor-2 (PAR-2) are implicated in neuroinflammation. Alpha-synuclein which induces neurodegeneration increases PAR-2 expression in the brain. However, the exact mechanisms are not yet understood. In this study, we quantified inflammatory mediators in the brains of MPTP-administered wild type (Wt), GMF-knockout (GMF-KO), and mast cell knockout (MC-KO) mice. Additionally, we analyzed the effect of MPP+, GMF, and mast cell proteases on PAR-2 expression in astrocytes and neurons in vitro. Results show that the levels of interleukin-1beta (IL-1β), tumor necrosis factor-alpha (TNF-α), and the chemokine (C-C motif) ligand 2 (CCL2) were lesser in the brains of GMF-KO mice and MC-KO mice when compared to Wt mice brain after MPTP administration. Incubation of astrocytes and neurons with MPP+, GMF, and mouse mast cell protease-6 (MMCP-6) and MMCP-7 increased the expression of PAR-2. Our studies show that the absence of mast cells and GMF reduce the expression of neuroinflammatory mediators in the brain. We conclude that GMF along with mast cell interactions with glial cells and neurons during neuroinflammation can be explored as a new therapeutic target for PD and other neuroinflammatory disorders.
Keywords: Astrocytes; PAR-2; Parkinson’s disease; cytokines; glia maturation factor; mast cells; mouse mast cell proteases.
Figures
Similar articles
-
Decoding Mast Cell-Microglia Communication in Neurodegenerative Diseases.Int J Mol Sci. 2021 Jan 22;22(3):1093. doi: 10.3390/ijms22031093. Int J Mol Sci. 2021. PMID: 33499208 Free PMC article. Review.
-
Mast Cell Proteases Activate Astrocytes and Glia-Neurons and Release Interleukin-33 by Activating p38 and ERK1/2 MAPKs and NF-κB.Mol Neurobiol. 2019 Mar;56(3):1681-1693. doi: 10.1007/s12035-018-1177-7. Epub 2018 Jun 18. Mol Neurobiol. 2019. PMID: 29916143 Free PMC article.
-
Dopaminergic Toxin 1-Methyl-4-Phenylpyridinium, Proteins α-Synuclein and Glia Maturation Factor Activate Mast Cells and Release Inflammatory Mediators.PLoS One. 2015 Aug 14;10(8):e0135776. doi: 10.1371/journal.pone.0135776. eCollection 2015. PLoS One. 2015. PMID: 26275153 Free PMC article.
-
Cross-Talk between Glia, Neurons and Mast Cells in Neuroinflammation Associated with Parkinson's Disease.J Neuroimmune Pharmacol. 2018 Mar;13(1):100-112. doi: 10.1007/s11481-017-9766-1. Epub 2017 Sep 26. J Neuroimmune Pharmacol. 2018. PMID: 28952015 Free PMC article.
-
Brain and Peripheral Atypical Inflammatory Mediators Potentiate Neuroinflammation and Neurodegeneration.Front Cell Neurosci. 2017 Jul 24;11:216. doi: 10.3389/fncel.2017.00216. eCollection 2017. Front Cell Neurosci. 2017. PMID: 28790893 Free PMC article. Review.
Cited by
-
Anti-Inflammatory and Neuroprotective Polyphenols Derived from the European Olive Tree, Olea europaea L., in Long COVID and Other Conditions Involving Cognitive Impairment.Int J Mol Sci. 2024 Oct 14;25(20):11040. doi: 10.3390/ijms252011040. Int J Mol Sci. 2024. PMID: 39456822 Free PMC article. Review.
-
Inhibition of PAR-2 Attenuates Neuroinflammation and Improves Short-Term Neurocognitive Functions Via ERK1/2 Signaling Following Asphyxia-Induced Cardiac Arrest in Rats.Shock. 2020 Oct;54(4):539-547. doi: 10.1097/SHK.0000000000001516. Shock. 2020. PMID: 32028357 Free PMC article.
-
Decoding Mast Cell-Microglia Communication in Neurodegenerative Diseases.Int J Mol Sci. 2021 Jan 22;22(3):1093. doi: 10.3390/ijms22031093. Int J Mol Sci. 2021. PMID: 33499208 Free PMC article. Review.
-
Recent advances in the use of CRISPR/Cas for understanding the early development of molecular gaps in glial cells.Front Cell Dev Biol. 2022 Sep 2;10:947769. doi: 10.3389/fcell.2022.947769. eCollection 2022. Front Cell Dev Biol. 2022. PMID: 36120556 Free PMC article. Review.
-
Beyond Anticoagulation: A Comprehensive Review of Non-Vitamin K Oral Anticoagulants (NOACs) in Inflammation and Protease-Activated Receptor Signaling.Int J Mol Sci. 2024 Aug 10;25(16):8727. doi: 10.3390/ijms25168727. Int J Mol Sci. 2024. PMID: 39201414 Free PMC article. Review.
References
Publication types
MeSH terms
Substances
Grants and funding
LinkOut - more resources
Full Text Sources
Molecular Biology Databases
Research Materials
