

Optical Fibre-Based Pulse Oximetry Sensor with Contact Force Detection
- PMID: 30373119
- PMCID: PMC6263952
- DOI: 10.3390/s18113632
Optical Fibre-Based Pulse Oximetry Sensor with Contact Force Detection
Abstract
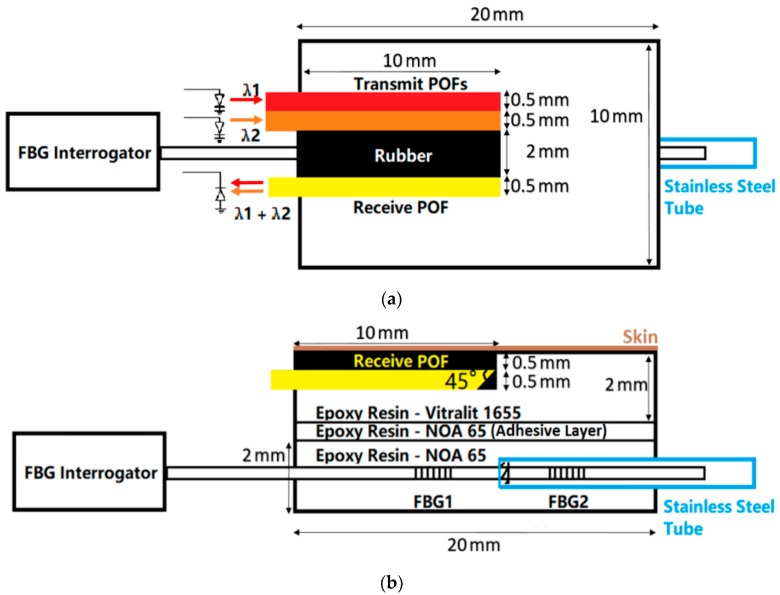
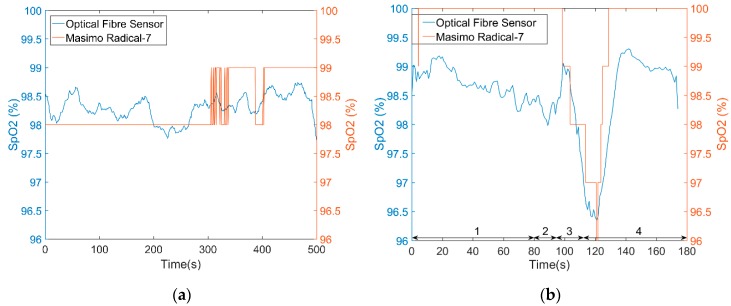
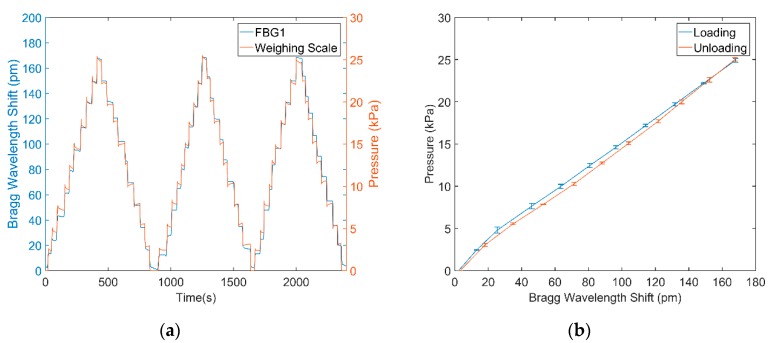
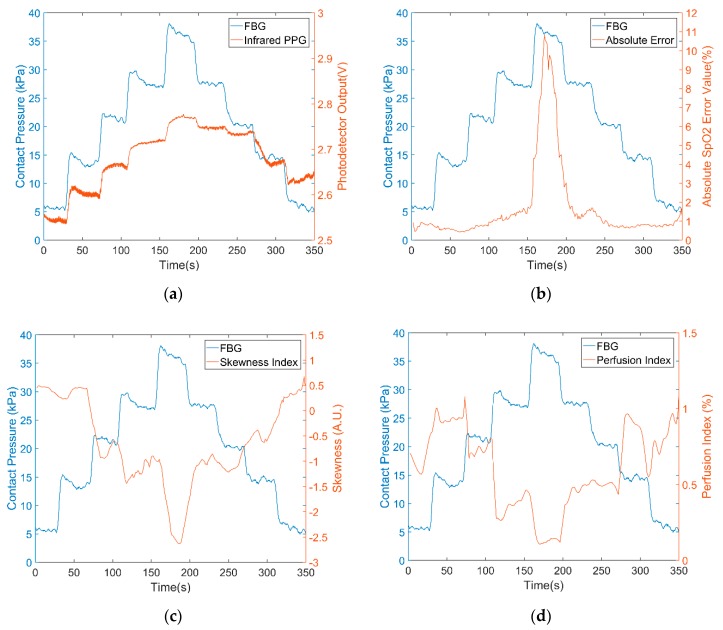
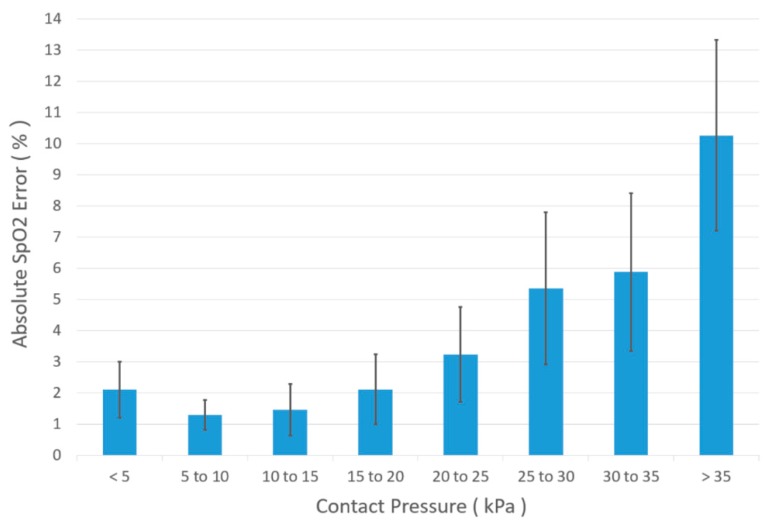
A novel optical sensor probe combining monitoring of blood oxygen saturation (SpO₂) with contact pressure is presented. This is beneficial as contact pressure is known to affect SpO₂ measurement. The sensor consists of three plastic optical fibres (POF) used to deliver and collect light for pulse oximetry, and a fibre Bragg grating (FBG) sensor to measure contact pressure. All optical fibres are housed in a biocompatible epoxy patch which serves two purposes: (i) to reduce motion artefacts in the photoplethysmogram (PPG), and (ii) to transduce transverse loading into an axial strain in the FBG. Test results show that using a combination of pressure measuring FBG with a reference FBG, reliable results are possible with low hysteresis which are relatively immune to the effects of temperature. The sensor is used to measure the SpO₂ of ten volunteers under different contact pressures with perfusion and skewness indices applied to assess the quality of the PPG. The study revealed that the contact force ranging from 5 to 15 kPa provides errors of <2%. The combined probe has the potential to improve the reliability of reflectance oximeters. In particular, in wearable technology, the probe should find use in optimising the fitting of garments incorporating this technology.
Keywords: contact pressure; fibre Bragg grating; oxygen saturation; photoplethysmography; plastic optical fibre; pulse oximetry; signal quality index.
Conflict of interest statement
The authors declare no conflict of interest.
Figures
Similar articles
-
Optical Fibre Sensor for Simultaneous Measurement of Capillary Refill Time and Contact Pressure.Sensors (Basel). 2020 Mar 3;20(5):1388. doi: 10.3390/s20051388. Sensors (Basel). 2020. PMID: 32138378 Free PMC article.
-
A Textile Sleeve for Monitoring Oxygen Saturation Using Multichannel Optical Fibre Photoplethysmography.Sensors (Basel). 2020 Nov 17;20(22):6568. doi: 10.3390/s20226568. Sensors (Basel). 2020. PMID: 33212998 Free PMC article.
-
Optical Fibre Sensor for Capillary Refill Time and Contact Pressure Measurements under the Foot.Sensors (Basel). 2021 Sep 10;21(18):6072. doi: 10.3390/s21186072. Sensors (Basel). 2021. PMID: 34577279 Free PMC article.
-
Pulse oximetry: fundamentals and technology update.Med Devices (Auckl). 2014 Jul 8;7:231-9. doi: 10.2147/MDER.S47319. eCollection 2014. Med Devices (Auckl). 2014. PMID: 25031547 Free PMC article. Review.
-
The use of photoplethysmography for assessing hypertension.NPJ Digit Med. 2019 Jun 26;2:60. doi: 10.1038/s41746-019-0136-7. eCollection 2019. NPJ Digit Med. 2019. PMID: 31388564 Free PMC article. Review.
Cited by
-
Fibre Bragg Grating Based Interface Pressure Sensor for Compression Therapy.Sensors (Basel). 2022 Feb 24;22(5):1798. doi: 10.3390/s22051798. Sensors (Basel). 2022. PMID: 35270942 Free PMC article.
-
A Comprehensive Review on the Optical Micro-Electromechanical Sensors for the Biomedical Application.Front Public Health. 2021 Dec 2;9:759032. doi: 10.3389/fpubh.2021.759032. eCollection 2021. Front Public Health. 2021. PMID: 34926383 Free PMC article.
-
Soft elastomeric optical fibers for oxygen change measurements of blood and living tissues: a thermoplastic polyurethane assessment.Biomed Opt Express. 2025 Jan 6;16(2):426-446. doi: 10.1364/BOE.549790. eCollection 2025 Feb 1. Biomed Opt Express. 2025. PMID: 39958869 Free PMC article.
-
Intra-tracheal multiplexed sensing of contact pressure and perfusion.Biomed Opt Express. 2021 Dec 3;13(1):48-64. doi: 10.1364/BOE.442165. eCollection 2022 Jan 1. Biomed Opt Express. 2021. PMID: 35154853 Free PMC article.
-
Noninvasive Continuous Monitoring of Vital Signs With Wearables: Fit for Medical Use?J Diabetes Sci Technol. 2021 Jan;15(1):34-43. doi: 10.1177/1932296820904947. Epub 2020 Feb 17. J Diabetes Sci Technol. 2021. PMID: 32063034 Free PMC article.
References
-
- Webster J.G. Design of Pulse Qximeters. CRC Press; Boca Raton, FL, USA: 1997.
-
- Babikir S.F., Ismail R.A. Oxygen Level Measurement Techniques: Pulse Oximetry. J. Sci. Technol. 2015;16:1–5.
Grants and funding
LinkOut - more resources
Full Text Sources
Other Literature Sources
