. 2018 Oct 26;19(11):3359.
doi: 10.3390/ijms19113359.

Identification of Salt Stress Responding Genes Using Transcriptome Analysis in Green Alga Chlamydomonas reinhardtii

Affiliations

Identification of Salt Stress Responding Genes Using Transcriptome Analysis in Green Alga Chlamydomonas reinhardtii

Ning Wang et al. Int J Mol Sci. .

Abstract

Salinity is one of the most important abiotic stresses threatening plant growth and agricultural productivity worldwide. In green alga Chlamydomonas reinhardtii, physiological evidence indicates that saline stress increases intracellular peroxide levels and inhibits photosynthetic-electron flow. However, understanding the genetic underpinnings of salt-responding traits in plantae remains a daunting challenge. In this study, the transcriptome analysis of short-term acclimation to salt stress (200 mM NaCl for 24 h) was performed in C. reinhardtii. A total of 10,635 unigenes were identified as being differently expressed by RNA-seq, including 5920 up- and 4715 down-regulated unigenes. A series of molecular cues were screened for salt stress response, including maintaining the lipid homeostasis by regulating phosphatidic acid, acetate being used as an alternative source of energy for solving impairment of photosynthesis, and enhancement of glycolysis metabolism to decrease the carbohydrate accumulation in cells. Our results may help understand the molecular and genetic underpinnings of salt stress responses in green alga C. reinhardtii.

Keywords: Chlamydomonas reinhardtii; impairment of photosynthesis; salt stress; transcriptome analysis; underpinnings of salt stress responses.


Conflict of interest statement

The authors declare no conflict of interest.

Figures

Figure 1
Figure 1
(A) The morphology of C. reinhardtii cells without addition of NaCl. (B) The morphology of C. reinhardtii cells under 200 mM NaCl treatment. (C) Venn diagram of functional annotations of unigenes in nt (NCBI non-redundant protein sequences), nr (NCBI non-redundant protein sequences), kog (Clusters of Orthologous Groups of proteins), go (Gene Ontology) and pfam (Protein family) databases. (D) Expression patterns of differentially expressed genes (DEGs) identified between 200 mM NaCl treated and control. S_200 indicated cells under 200 mM NaCl stressed condition for 24 h; C_0 indicated cells cultured under control condition. Red and green dots represent DEGs, blue dots indicate genes that were not differentially expressed. In total, 10,635 unigenes were identified as DEGs (padj < 0.05) between S_200 and C_0, including 5920 upregulated genes and 4715 downregulated genes.
Figure 2
Figure 2
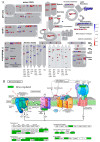
(A) Global view of differently expressed genes (DEGs) involved in diverse metabolic pathways. DEGs genes were selected for the metabolic pathways analysis using the MapMan software (3.5.1 R2). The colored boxes indicate the Log2 of expression ratio of DEGs genes. The dys-regulated unigenes were assigned to 1334 and 1050 homologs in Arabidopsis, respectively. These genes were mapped to 797 pathways by MapMan, of which, 22 pathways were filtered enriched by the dys-regulated genes with the cutoff p-value < 0.05. (B) The KEGG pathways (ko00195) “photosynthesis” mapped with 44 down-regulated unigenes. The down-regulated genes are marked by a green frame. The black solid line with a black arrow means molecular interaction or relation; the black dash line with a black arrow means indirect link or unknown reaction; the red dash line with a red arrow stands for the light quanta.
Figure 3
Figure 3
Real-time PCR verification of five up-regulated genes in C. reinhardtii. The red bars represent the qPCR results of samples under salt stress condition, while the corresponding blue bars represent the results of control samples. The individual black bars, representing the qPCR data, are the means ± SD of nine measurements (three technical replicates each for three biological samples).

Similar articles

Cited by

References

    1. Munns R., Tester M. Mechanisms of salinity tolerance. Annu. Rev. Plant Boil. 2008;59:651–681. doi: 10.1146/annurev.arplant.59.032607.092911. - DOI - PubMed
    1. Song J., Wang B.S. Using euhalophytes to understand salt tolerance and to develop saline agriculture: Suaeda salsa as a promising model. Ann. Bot. 2015;115:541–553. doi: 10.1093/aob/mcu194. - DOI - PMC - PubMed
    1. Epstein E. Salt-tolerant crops: Origins, development, and prospects of the concept. Plant Soil. 1985;89:187–198. doi: 10.1007/BF02182242. - DOI
    1. Zhang L.Y., Zhang X.J., Fan S.J. Meta-analysis of salt-related gene expression profiles identifies common signatures of salt stress responses in Arabidopsis. Plant Syst. Evol. 2017;303:757–774. doi: 10.1007/s00606-017-1407-x. - DOI
    1. Yuan F., Leng B.Y., Wang B.S. Progress in Studying Salt Secretion from the Salt Glands in Recretohalophytes: How Do Plants Secrete Salt? Front. Plant Sci. 2016;7:977. doi: 10.3389/fpls.2016.00977. - DOI - PMC - PubMed

LinkOut - more resources