. 2018 Oct 28;19(11):3375.
doi: 10.3390/ijms19113375.

The Potential Role of a Soluble γ-Chain Cytokine Receptor as a Regulator of IL-7-Induced Lymphoproliferative Disorders

Affiliations

The Potential Role of a Soluble γ-Chain Cytokine Receptor as a Regulator of IL-7-Induced Lymphoproliferative Disorders

Geona Kim et al. Int J Mol Sci. .

Abstract

IL-7 is an essential, nonredundant growth factor for T and B cell generation and maintenance. While IL-7 deficiency results in lymphopenia, overexpression of IL-7 can cause neoplasia in experimental models. IL-7's involvement in neoplasia has been appreciated through studies of IL-7 transgenic (Tg) mice models and human lymphoma patients. Since we recently found that a soluble form of the common γ-chain (γc) cytokine receptor (sγc) antagonistically regulates IL-7 signaling, IL-7 and sγc double-Tg mice were generated to investigate the effects of sγc overexpression in IL-7-mediated lymphoproliferative disorders (LPDs). The overexpression of sγc prevents IL-7Tg-induced abnormal increase of LN cell numbers and the development of splenomegaly, resulting in striking amelioration of mortality and disease development. These results suggest that modification of γc cytokine responsiveness by sγc molecules might control various γc cytokine-associated hematologic malignancy, and also provide an alternative view to approach antitumor therapy.

Keywords: IL-7; cytokine; lymphoma; sγc.


Conflict of interest statement

The authors declare no conflict of interest.

Figures

Figure 1
Figure 1
sγc levels affect IL-7-induced mortality. sγcTg mice were crossed with IL-7Tg mice and monitored weekly for lesions, node enlargement, and survival over eight months. (a) sγc levels in wild-type (WT), sγcTg, IL-7Tg, and sγc7Tg serum were measured by ELISA. (b) Survival of WT (n = 16), sγcTg (n = 14), IL-7Tg (n = 15), and sγc7Tg (n = 10) mice were monitored every week. (c) Total lymph-node (LN) and spleen (SP) cell numbers in indicated mice. Each symbol represents an indicated individual mouse. Horizontal lines indicate mean and SD. (d) Gross anatomy of spleens from the indicated mice. Picture shows representative spleen from n > 5 mice per group. (e) Summary of spleen weight from indicated mice. * p < 0.05, ** p < 0.01, *** p < 0.001, and NS mean not significant.
Figure 2
Figure 2
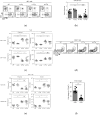
Frequency and total numbers of B, T, and B-T- (DN) cells in LN from the indicated mice. (a) Contour plots show TCRβ/B220 profiles and percentages of B, T and DN cells, respectively. (b) Summary of B, T, and DN cell frequency and numbers. Each symbol represents an indicated individual mouse. Horizontal lines indicate mean and SD. * p < 0.05, ** p < 0.01, *** p < 0.001, and NS mean not significant.
Figure 3
Figure 3
Analysis of CD4+ and CD8+ LN T cells. (a) Contour plots show CD4/CD8 profiles and percentages of CD4+ and CD8+ T cells, respectively. (b) CD4/CD8 ratio in the indicated mice. Each symbol represents an indicated individual mouse. Error bars represent mean and SD. (c) Summary of frequency and total numbers of CD4+ and CD8+ T cells in the indicated mice. Each symbol represents an indicated individual mouse. Horizontal lines indicate mean and SD. (d) Contour plots show CD44/CD122 profiles and percentages of CD44−CD122low naïve and CD44+CD122hi memory T cells, respectively. (e) Naïve- and memory-phenotype analysis of CD8+ T cells. Frequency and total numbers of naive and memory CD8+ T cells in the indicated mice were analyzed. Each symbol represents an indicated individual mouse. Horizontal lines indicate mean and SD. (f) Fold change of CD4+ and CD8+ T cells between IL-7Tg and WT mice. Each symbol represents an indicated individual mouse. Error bars represent mean and SD. * p < 0.05, ** p < 0.01, *** p < 0.001, and NS mean not significant.
Figure 4
Figure 4
Frequency and total numbers of NKT, γδT, and NK cells in LN from indicated mice. Contour plots show (a) TCRβ/CD1dtet, (c) TCRβ/γδTCR, and (e) TCRβ/NK1.1 profiles and percentages of NKT, γδT, and NK cells, respectively. Summary of (b) NKT, (d) γδT, and (f) NK cell frequency and numbers. Each symbol represents an indicated individual mouse. Horizontal lines indicate mean and SD. * p < 0.05, ** p < 0.01, *** p < 0.001, and NS mean not significant.

Similar articles

Cited by

References

    1. Hong C., Luckey M.A., Park J.H. Intrathymic IL-7: The where, when, and why of IL-7 signaling during T cell development. Semin. Immunol. 2012;24:151–158. doi: 10.1016/j.smim.2012.02.002. - DOI - PMC - PubMed
    1. Foss H.D., Hummel M., Gottstein S., Ziemann K., Falini B., Herbst H., Stein H. Frequent expression of IL-7 gene transcripts in tumor cells of classical Hodgkin’s disease. Am. J. Pathol. 1995;146:33–39. - PMC - PubMed
    1. Touw I., Pouwels K., van Agthoven T., van Gurp R., Budel L., Hoogerbrugge H., Delwel R., Goodwin R., Namen A., Lowenberg B. Interleukin-7 is a growth factor of precursor B and T acute lymphoblastic leukemia. Blood. 1990;75:2097–2101. - PubMed
    1. Rochman Y., Spolski R., Leonard W.J. New insights into the regulation of T cells by gamma(c) family cytokines. Nat. Rev. Immunol. 2009;9:480–490. doi: 10.1038/nri2580. - DOI - PMC - PubMed
    1. Abraham N., Ma M.C., Snow J.W., Miners M.J., Herndier B.G., Goldsmith M.A. Haploinsufficiency identifies STAT5 as a modifier of IL-7-induced lymphomas. Oncogene. 2005;24:5252–5257. doi: 10.1038/sj.onc.1208726. - DOI - PubMed

MeSH terms

Substances

LinkOut - more resources