Meta-Analysis
. 2018 Oct 30;16(1):196.
doi: 10.1186/s12916-018-1180-x.

Global variation in bacterial strains that cause tuberculosis disease: a systematic review and meta-analysis

Affiliations
Meta-Analysis

Global variation in bacterial strains that cause tuberculosis disease: a systematic review and meta-analysis

Kirsten E Wiens et al. BMC Med. .

Abstract

Background: The host, microbial, and environmental factors that contribute to variation in tuberculosis (TB) disease are incompletely understood. Accumulating evidence suggests that one driver of geographic variation in TB disease is the local ecology of mycobacterial genotypes or strains, and there is a need for a comprehensive and systematic synthesis of these data. The objectives of this study were to (1) map the global distribution of genotypes that cause TB disease and (2) examine whether any epidemiologically relevant clinical characteristics were associated with those genotypes.

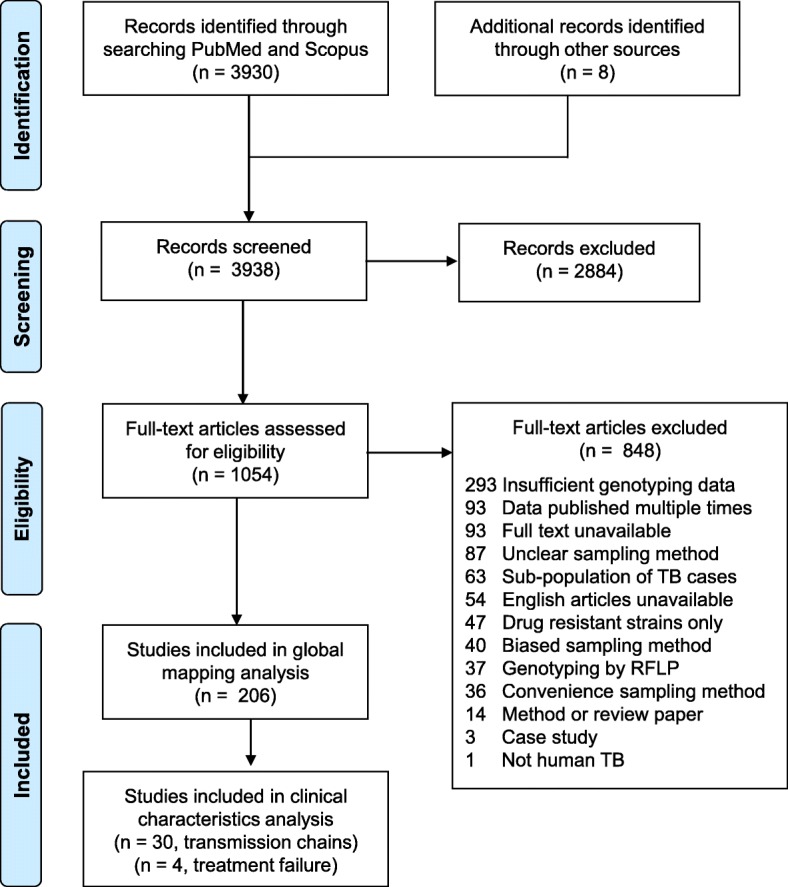
Methods: We performed a systematic review of PubMed and Scopus to create a comprehensive dataset of human TB molecular epidemiology studies that used representative sampling techniques. The methods were developed according to the Preferred Reporting Items for Systematic Reviews and Meta-Analyses (PRISMA). We extracted and synthesized data from studies that reported prevalence of bacterial genotypes and from studies that reported clinical characteristics associated with those genotypes.

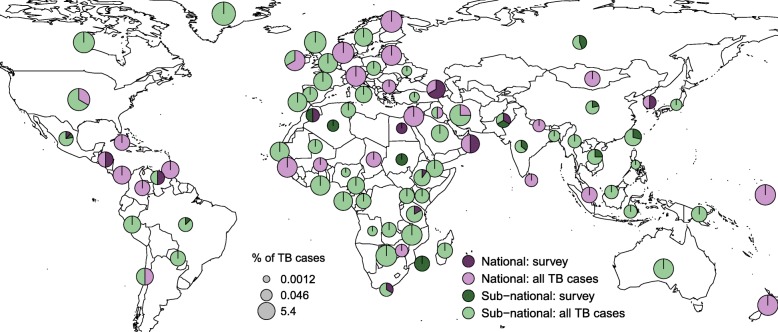
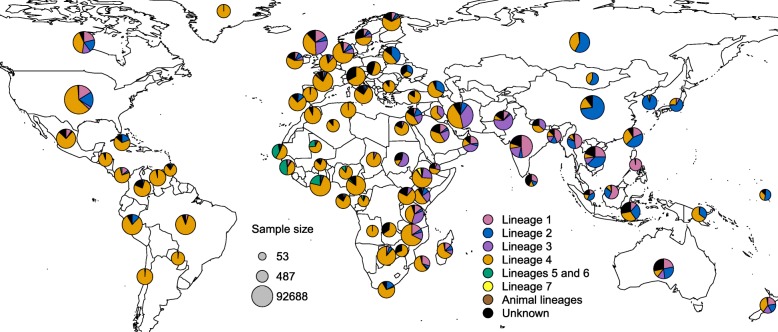
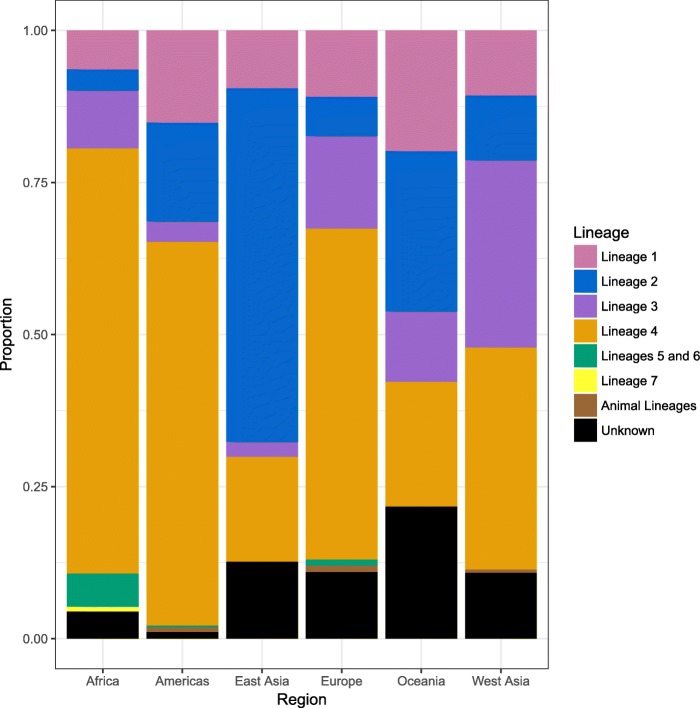
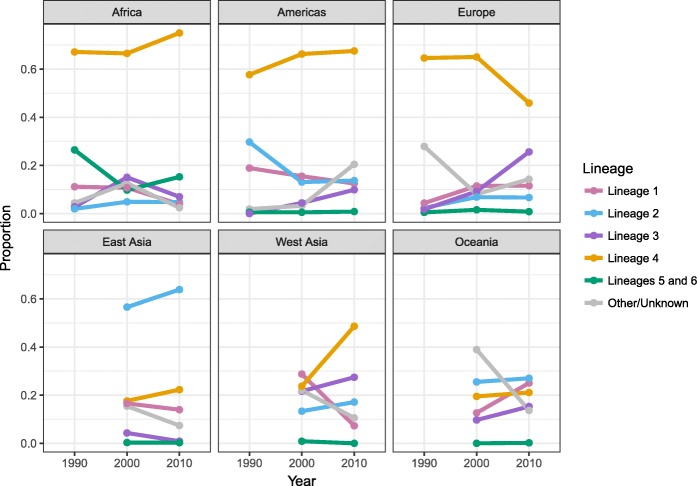
Results: The results of this study are twofold. First, we identified 206 studies for inclusion in the study, representing over 200,000 bacterial isolates collected over 27 years in 85 countries. We mapped the genotypes and found that, consistent with previously published maps, Euro-American lineage 4 and East Asian lineage 2 strains are widespread, and West African lineages 5 and 6 strains are geographically restricted. Second, 30 studies also reported transmission chains and 4 reported treatment failure associated with genotypes. We performed a meta-analysis and found substantial heterogeneity across studies. However, based on the data available, we found that lineage 2 strains may be associated with increased risk of transmission chains, while lineages 5 and 6 strains may be associated with reduced risk, compared with lineage 4 strains.

Conclusions: This study provides the most comprehensive systematic analysis of the evidence for diversity in bacterial strains that cause TB disease. The results show both geographic and epidemiological differences between strains, which could inform our understanding of the global burden of TB. Our findings also highlight the challenges of collecting the clinical data required to inform TB diagnosis and treatment. We urge future national TB programs and research efforts to prioritize and reinforce clinical data collection in study designs and results dissemination.

Keywords: Epidemiology; Genetic variation; Genotype; Molecular epidemiology; Mycobacterium tuberculosis; Tuberculosis.


Conflict of interest statement

Ethics approval and consent to participate

Not applicable.

Consent for publication

Not applicable.

Competing interests

The authors declare that they have no competing interests.

Publisher’s Note

Springer Nature remains neutral with regard to jurisdictional claims in published maps and institutional affiliations.

Figures

Fig. 1
Fig. 1
PRISMA flow diagram. Diagram illustrating the literature selection process, including identification, screening, eligibility, and total studies included in the global analysis and clinical characteristic analysis. Reasons for exclusion of full texts are detailed. Individual-level details of each study reviewed are found in Additional file 2
Fig. 2
Fig. 2
Variation in sampling methods of studies included in the systematic review. Variation in study design for the 206 studies that met the inclusion criteria for this systematic review. The proportion of studies in each country that collected a nationally representative sample versus a sample representative of a smaller geographic location are shown in purple and green, respectively. Light purple and green indicate the proportion of studies in each country that collected all reported or all new TB cases in a given location and time period. For the majority of studies, “all TB cases” represents culture-positive cases only; for studies that use GeneXpert remnants for DNA collection, this represents microscopy-positive cases. Dark purple and green indicate the proportion of studies in a given country that used a random or cluster-based survey sampling method to select a subset of cases. TB cases in each country were estimated by the Global Burden of Disease Study 2016 [40]. We calculated percent of all TB cases in each country using the total number of genotyped cases as the numerator and total estimated prevalent TB cases as the denominator. The radius of each pie is proportional to percent of total estimated TB cases that are represented across all studies in each country. Examples of percent of total estimated TB cases that correspond to pie sizes are shown in the legend in gray. The example pies show the minimum, mid-point, and maximum percent of estimated TB cases represented in this review
Fig. 3
Fig. 3
The global distribution and genetic diversity and of MTBC phylogenetic lineages. MTBC global genotype distribution by country across all years based on a systematic review of TB molecular epidemiology studies employing one of four genotyping methods: (1) spoligotyping, (2) MLVA typing, (3) PCR typing for large sequence polymorphisms, and (4) whole-genome sequencing. All genotyping methods are converted to a common classification system based on phylogenetic lineages (Additional file 1: Tables S1 and S2), and pie charts show the proportion of lineages present in each country where data was available and studies met our inclusion criteria. Indo-Oceanic lineage 1 is shown in pink, lineage 2 is shown in blue, East African-Indian lineage 3 is shown in purple, Euro-American lineage 4 is shown in orange, West African lineages 5 and 6 are shown in green, and Ethiopian lineage 7 is shown in yellow. “Unknown” represents strain types that were not identified by the authors either due to low frequency or unknown genetic patterns. Studies that report prevalence of only one lineage and grouped all other genotypes as “other” are excluded from the map. If multiple studies were available in a country, strain counts were summed across all studies to get final proportions and sample sizes. The radius of each pie is proportional to the number of isolates collected in each country. Examples of sample sizes that correspond to pie sizes are shown in the legend in gray. The example pies shown represent the minimum, mid-point, and maximum samples sizes
Fig. 4
Fig. 4
Distribution of MTBC phylogenetic lineages by region. MTBC global genotype distribution by region corresponding to the data presented in Fig. 3. Lineage proportions broken down by countries within each region are shown in Additional file 1: Table S3 and Figure S2
Fig. 5
Fig. 5
Distribution of MTBC lineages over time by region. MTBC genotype distribution by region over time corresponding to results presented in Additional file 1: Figure S3. The year 1990 represents all studies from 1990 to 1999, the year 2000 represents all studies from 2000 to 2009, and the year 2010 represents all studies from 2010 to 2017. Indo-Oceanic lineage 1 is shown in pink, East Asian lineage 2 is shown in blue, East African-Indian lineage 3 is shown in purple, Euro-American lineage 4 is shown in orange, and West African lineages 5 and 6 are shown in green. Other/unknown strains are shown in gray and represent animal lineages, lineage 7, and strain types that were not identified by authors either due to low frequency or unknown genetic patterns. Strain counts and sample sizes were summed across all studies within the given regions and time periods to get proportions. There was no data from East Asia, West Asia, and Oceania in the 1990s, and therefore, these years are left blank

Similar articles

Cited by

References

    1. Kyu HH, Maddison ER, Henry NJ, Mumford JE, Barber R, Shields C, et al. The global burden of tuberculosis: results from the Global Burden of Disease (GBD) Study 2015. Lancet Infect Dis. 2018;18:261–284. doi: 10.1016/S1473-3099(17)30703-X. - DOI - PMC - PubMed
    1. Getahun H, Matteelli A, Chaisson RE, Raviglione M. Latent Mycobacterium tuberculosis infection. 10.1056/NEJMra1405427. 2015. doi:10.1056/NEJMra1405427. - PubMed
    1. Dye Christopher. The Population Biology of Tuberculosis. 2017.
    1. Comas I, Gagneux S. A role for systems epidemiology in tuberculosis research. Trends Microbiol. 2011;19:492–500. doi: 10.1016/j.tim.2011.07.002. - DOI - PMC - PubMed
    1. Abel Laurent, Fellay Jacques, Haas David W, Schurr Erwin, Srikrishna Geetha, Urbanowski Michael, Chaturvedi Nimisha, Srinivasan Sudha, Johnson Daniel H, Bishai William R. Genetics of human susceptibility to active and latent tuberculosis: present knowledge and future perspectives. The Lancet Infectious Diseases. 2018;18(3):e64–e75. doi: 10.1016/S1473-3099(17)30623-0. - DOI - PMC - PubMed

Publication types