

Restoration of regulatory B cell deficiency following alemtuzumab therapy in patients with relapsing multiple sclerosis
- PMID: 30373595
- PMCID: PMC6206644
- DOI: 10.1186/s12974-018-1334-y
Restoration of regulatory B cell deficiency following alemtuzumab therapy in patients with relapsing multiple sclerosis
Abstract
Background: Regulatory B cells (Bregs), which protect from autoimmunity, are deficient in multiple sclerosis (MS). Novel regulatory B cell subsets CD19+CD24hiCD38hi cells and CD19+PD-L1hi cells, with disparate regulatory mechanisms have been defined. Alemtuzumab provides a long-lasting suppression of disease activity in MS. In contrast to its documented efficacy, alemtuzumab's mechanism of action is not fully understood and information about the composition of repopulating B cell pool is scarce.
Aim: To characterize repopulated B cell subsets and elucidate alemtuzumab's mechanism of action in B cell perspective.
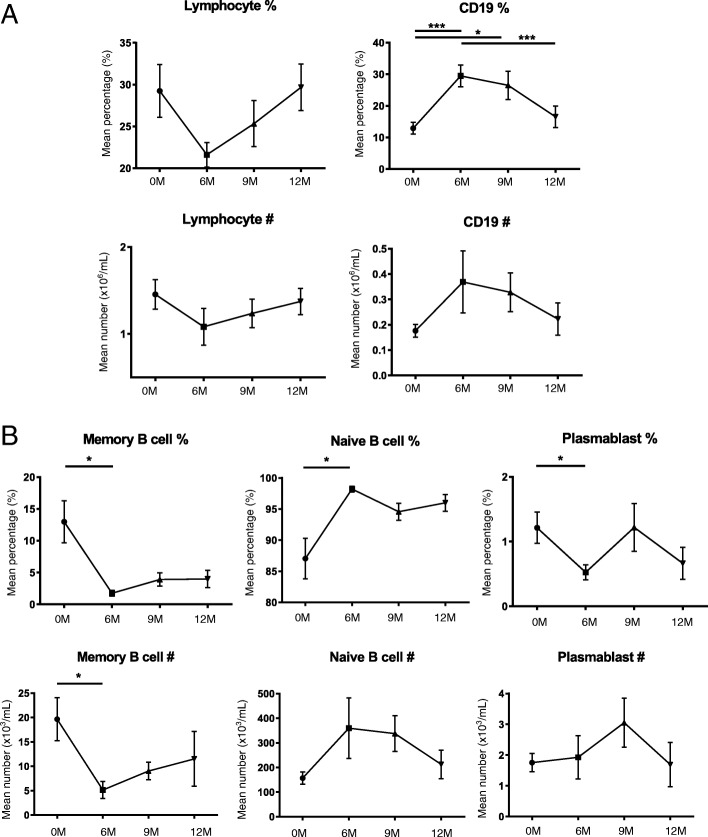
Methods: The frequency and the absolute number of Bregs were studied in peripheral blood mononuclear cells (PBMC) of 37 MS patients and 11 healthy controls (HC). Longitudinal analysis of the frequency and the absolute number of Bregs in PBMC of 11 MS patients was evaluated, before and at 6, 9, and 12 months post alemtuzumab.
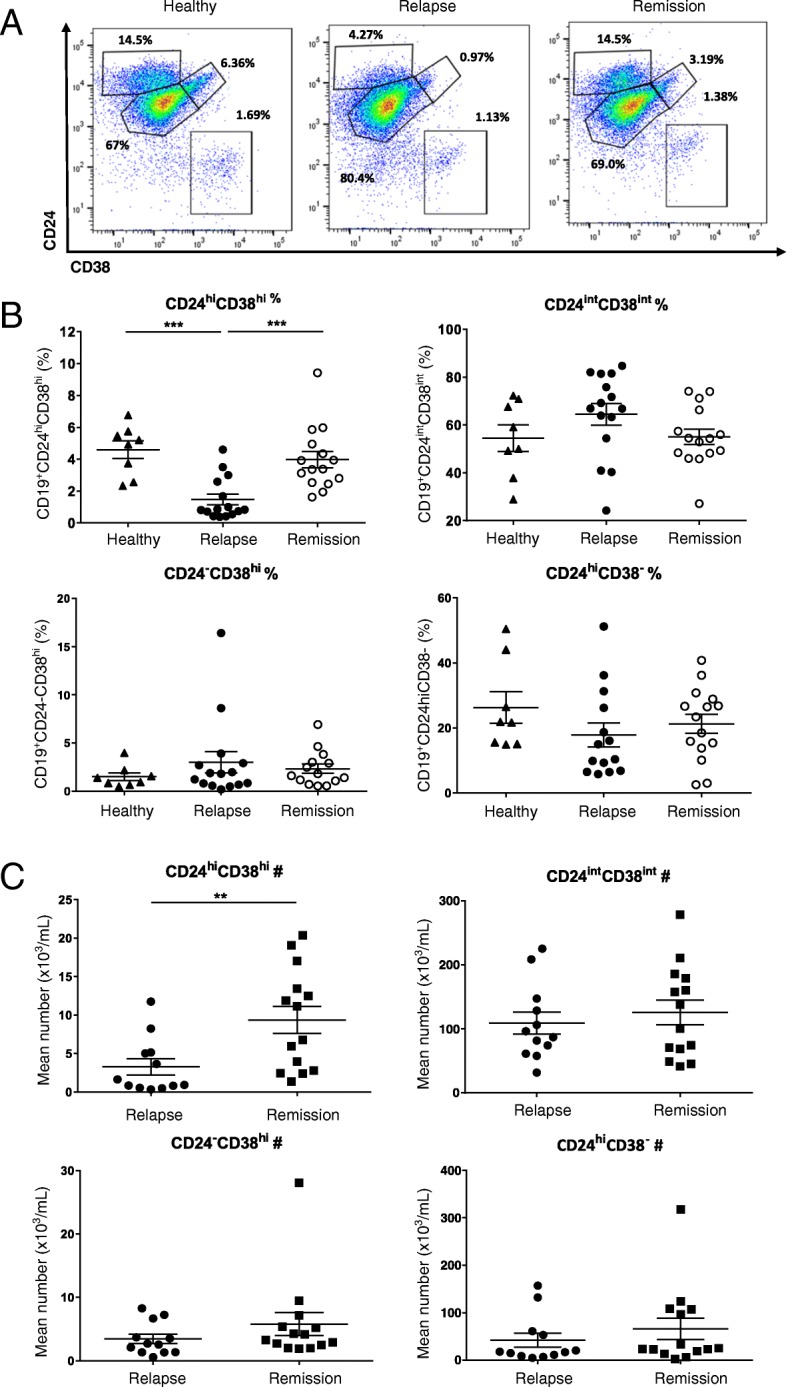
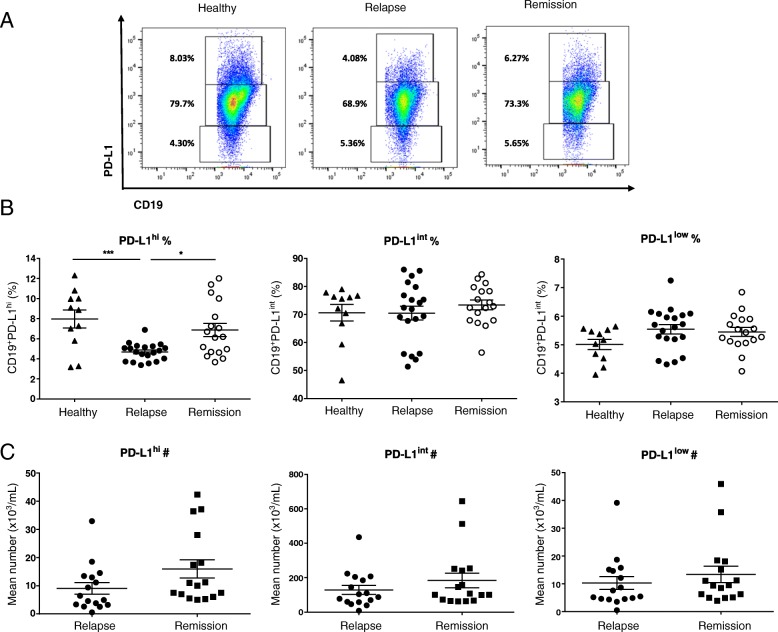
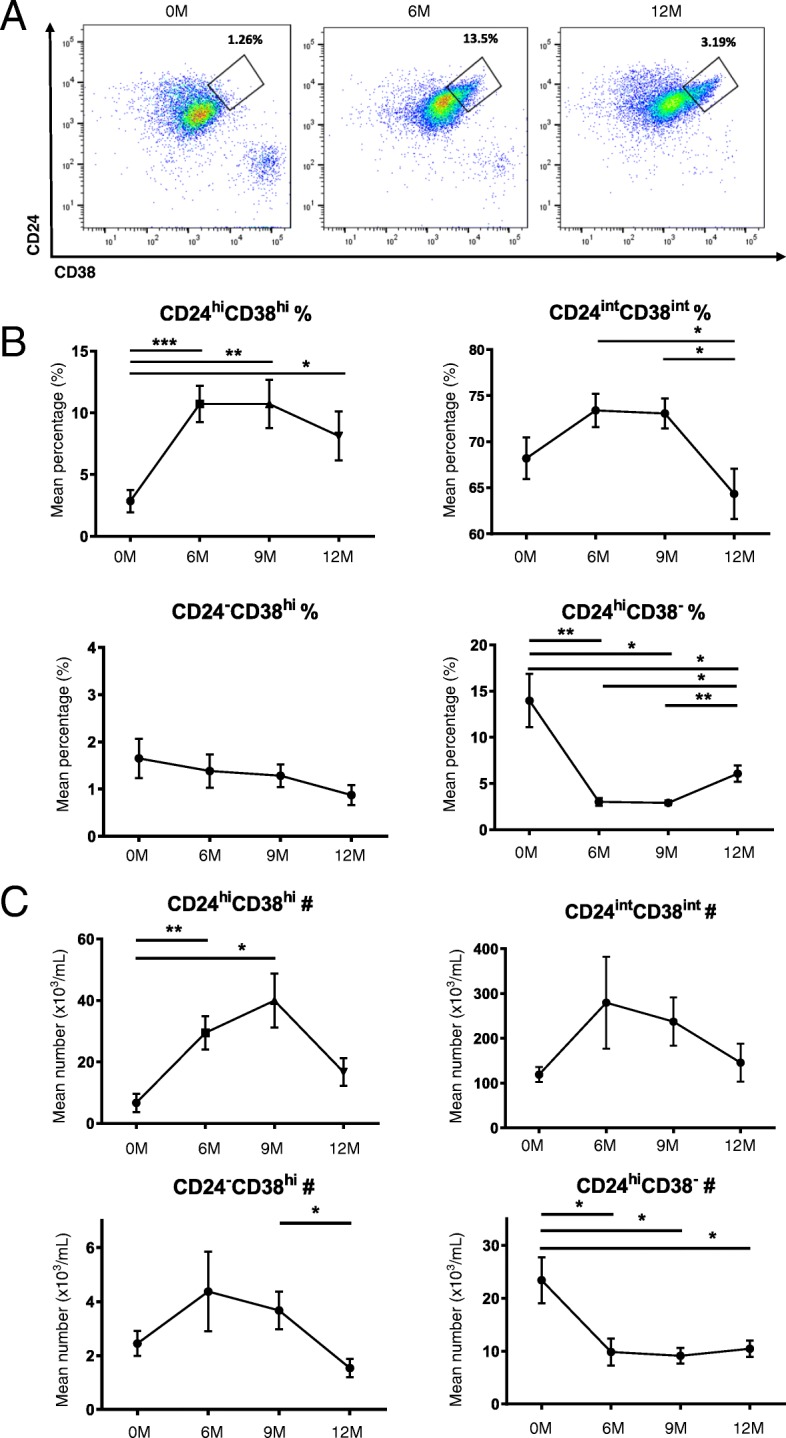
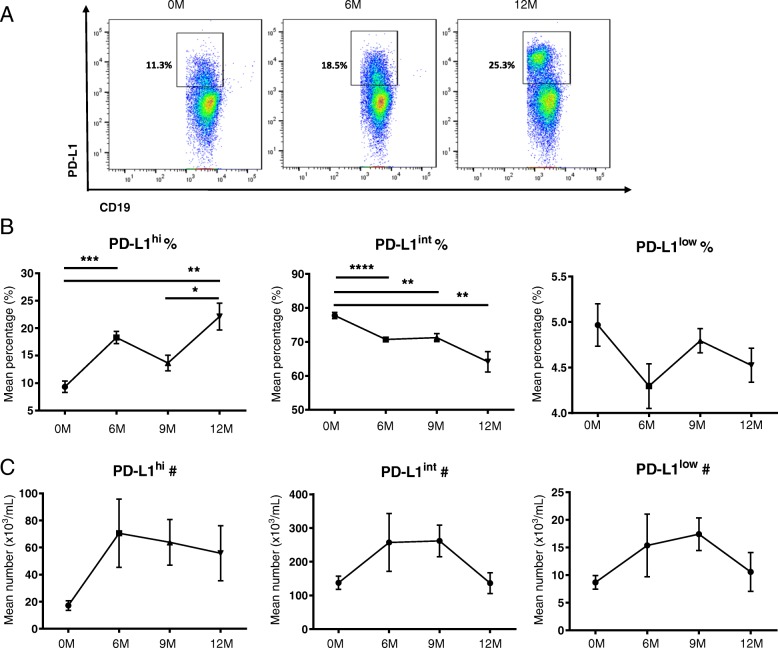
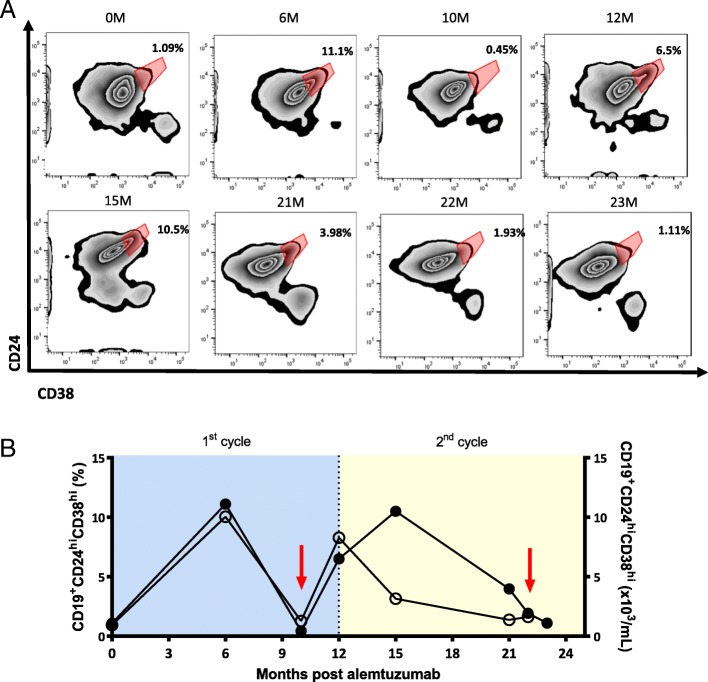
Results: We found deficiency of CD19+CD24hiCD38hi cells during relapse compared to remission and HC (relapse vs remission: p = 0.0006, relapse vs HC: p = 0.0004). CD19+PD-L1hi cells were deficient during relapse than remission and HC (relapse vs remission: p = 0.0113, relapse vs HC: p = 0.0007). Following alemtuzumab, the distribution of B cells shifts towards naïve phenotype and Breg deficiency is restored. The frequency of CD19+CD24hiCD38hi cells was significantly increased at 6 M and 9 M compared to 0 M (6 M vs 0 M: p = 0.0004, 9 M vs 0 M: p = 0.0079). At 9 M, the frequency of CD19+CD24hiCD38hi cells started to decrease and by 12 M the frequency was reduced compared to 6 M, although it was significantly higher than baseline level (12 M vs 0 M: p = 0.0257). The absolute number was significantly increased at 6 M and 9 M post-alemtuzumab (6 M vs 0 M: p = 0.0063, 9 M vs 0 M: p = 0.02). The frequency of CD19+PD-L1hi cells significantly increased until 12 M (6 M vs 0 M: p = 0.0004, 12 M vs 0 M: p = 0.0036). The frequency of CD19+PD-L1hi cells at 12 M was significantly higher than 9 M (p = 0.0311). We further pinpoint that CD19+CD24hiCD38hi cells were deficient at severe relapses following alemtuzumab infusion and restored during recovery.
Conclusions: Our results highlight the preferential reconstitution of Bregs as a possible mechanism of action of alemtuzumab and CD19+CD24hiCD38hi cells as a potential biomarker for disease activity.
Keywords: Alemtuzumab; Multiple sclerosis; Regulatory B cells; Relapse.
Conflict of interest statement
Ethics approval and consent to participate
The Institutional Review Board of NCC approved the present study, and written informed consent was obtained from all participants.
Consent for publication
Not applicable.
Competing interests
Kim YS, Kim GY, Hyun JW, Kim SH, and Shin HJ report no conflicts of interest. Kim HJ has lectured, consulted, and received honoraria from Bayer Schering Pharma, Biogen, Celltrion, Eisai, Genzyme,
Publisher’s Note
Springer Nature remains neutral with regard to jurisdictional claims in published maps and institutional affiliations.
Figures
Similar articles
-
PD-L1+ Regulatory B Cells Are Significantly Decreased in Rheumatoid Arthritis Patients and Increase After Successful Treatment.Front Immunol. 2018 Oct 1;9:2241. doi: 10.3389/fimmu.2018.02241. eCollection 2018. Front Immunol. 2018. PMID: 30327652 Free PMC article.
-
Regulatory B cells (CD19(+)CD38(hi)CD24(hi)) in alloimmunized and non-alloimmunized children with β-thalassemia major.Blood Cells Mol Dis. 2016 Mar;57:91-6. doi: 10.1016/j.bcmd.2016.01.005. Epub 2016 Jan 20. Blood Cells Mol Dis. 2016. PMID: 26852663
-
Interleukin-35 promotes Breg expansion and interleukin-10 production in CD19+ B cells in patients with ankylosing spondylitis.Clin Rheumatol. 2022 Aug;41(8):2403-2416. doi: 10.1007/s10067-022-06137-8. Epub 2022 Apr 14. Clin Rheumatol. 2022. PMID: 35420296 Free PMC article.
-
The role of B regulatory (B10) cells in inflammatory disorders and their potential as therapeutic targets.Int Immunopharmacol. 2020 Jan;78:106111. doi: 10.1016/j.intimp.2019.106111. Epub 2019 Dec 24. Int Immunopharmacol. 2020. PMID: 31881524 Review.
-
Alemtuzumab as rescue therapy in case of multiple sclerosis rebound following Natalizumab break: Clinical case and literature review.Mult Scler Relat Disord. 2019 May;30:262-264. doi: 10.1016/j.msard.2019.03.002. Epub 2019 Mar 5. Mult Scler Relat Disord. 2019. PMID: 30851640 Review.
Cited by
-
Autoreactive lymphocytes in multiple sclerosis: Pathogenesis and treatment target.Front Immunol. 2022 Sep 23;13:996469. doi: 10.3389/fimmu.2022.996469. eCollection 2022. Front Immunol. 2022. PMID: 36211343 Free PMC article. Review.
-
Efficacy and Safety of Alemtuzumab in Patients of African Descent with Relapsing-Remitting Multiple Sclerosis: 8-Year Follow-up of CARE-MS I and II (TOPAZ Study).Neurol Ther. 2019 Dec;8(2):367-381. doi: 10.1007/s40120-019-00159-2. Epub 2019 Oct 25. Neurol Ther. 2019. PMID: 31654272 Free PMC article.
-
Immune Regulatory Cell Bias Following Alemtuzumab Treatment in Relapsing-Remitting Multiple Sclerosis.Front Immunol. 2021 Oct 28;12:706278. doi: 10.3389/fimmu.2021.706278. eCollection 2021. Front Immunol. 2021. PMID: 34777337 Free PMC article.
-
The immunological bases of alemtuzumab as induction-therapy in pediatric-onset multiple sclerosis.Front Immunol. 2025 Jan 8;15:1509987. doi: 10.3389/fimmu.2024.1509987. eCollection 2024. Front Immunol. 2025. PMID: 39845956 Free PMC article. Review.
-
Sustained effects on immune cell subsets and autoreactivity in multiple sclerosis patients treated with oral cladribine.Front Immunol. 2024 Feb 16;15:1327672. doi: 10.3389/fimmu.2024.1327672. eCollection 2024. Front Immunol. 2024. PMID: 38433828 Free PMC article.
References
-
- Weber MS, Hemmer B, Cepok S. The role of antibodies in multiple sclerosis. Biochim Biophys Acta. 1812;2011:239–245. - PubMed
MeSH terms
Substances
Grants and funding
LinkOut - more resources
Full Text Sources
Other Literature Sources
Research Materials
