

Developing a representative community health survey sampling frame using open-source remote satellite imagery in Mozambique
- PMID: 30373621
- PMCID: PMC6206736
- DOI: 10.1186/s12942-018-0158-4
Developing a representative community health survey sampling frame using open-source remote satellite imagery in Mozambique
Abstract
Background: Lack of accurate data on the distribution of sub-national populations in low- and middle-income countries impairs planning, monitoring, and evaluation of interventions. Novel, low-cost methods to develop unbiased survey sampling frames at sub-national, sub-provincial, and even sub-district levels are urgently needed. This article details our experience using remote satellite imagery to develop a provincial-level representative community survey sampling frame to evaluate the effects of a 7-year health system intervention in Sofala Province, Mozambique.
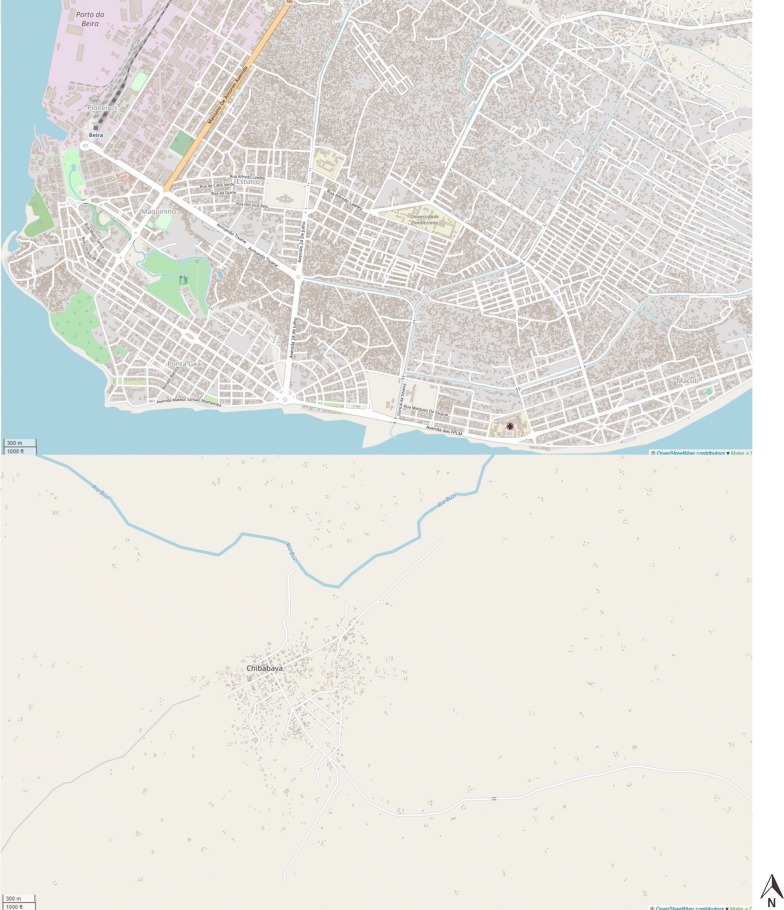
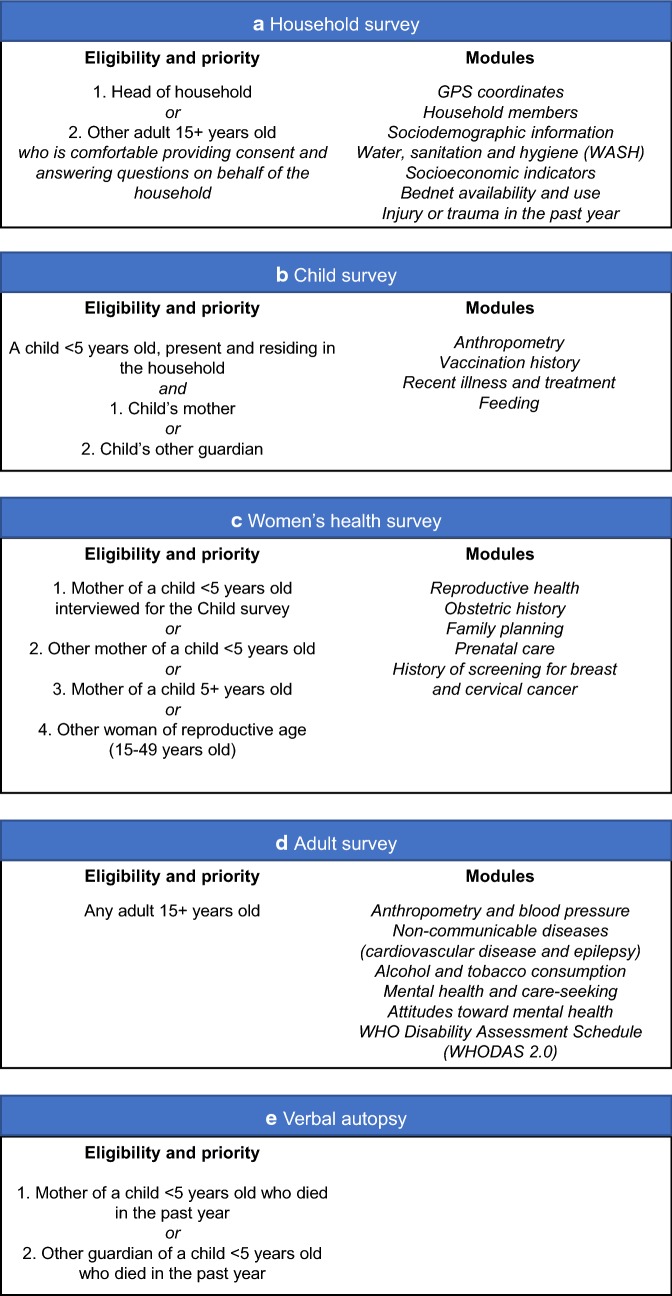
Methods: Mozambique's most recent census was conducted in 2007, and no data are readily available to generate enumeration areas for representative health survey sampling frames. To remedy this, we partnered with the Humanitarian OpenStreetMap Team to digitize every building in Sofala and Manica provinces (685,189 Sofala; 925,713 Manica) using up-to-date remote satellite imagery, with final results deposited in the open-source OpenStreetMap database. We then created a probability proportional to size sampling frame by overlaying a grid of 2.106 km resolution (0.02 decimal degrees) across each province, and calculating the number of buildings within each grid square. Squares containing buildings were used as our primary sampling unit with replacement. Study teams navigated to the geographic center of each selected square using geographic positioning system coordinates, and then conducted a standard "random walk" procedure to select 20 households for each time a given square was selected. Based on sample size calculations, we targeted a minimum of 1500 households in each province. We selected 88 grids within each province to reach 1760 households, anticipating ongoing conflict and transport issues could preclude the inclusion of some clusters.
Results: Civil conflict issues forced the exclusion of 8 of 31 subdistricts in Sofala and 15 of 39 subdistricts in Manica. Using Android tablets, Open Data Kit software, and a remote RedCap data capture system, our final sample included 1549 households in Sofala (4669 adults; 4766 children; 33 missing age) and 1538 households in Manica (4422 adults; 4898 children; 33 missing age).
Conclusions: Other implementation or evaluation teams may consider employing similar methods to track population distributions for health systems planning or the development of representative sampling frames using remote satellite imagery.
Keywords: Evaluation; Geographic information systems; Mozambique; Remote sensing; Sampling; Satellite imagery; Survey design.
Figures


References
-
- ICF International . Sampling and household listing manual: demographic and health surveys methodology. Maryland: Calverton; 2012.
-
- UNICEF. Multiple indicator cluster survey manual: chapter 4 designing and selecting the sample. 2017.
Publication types
MeSH terms
LinkOut - more resources
Full Text Sources
