. 2018 Nov 27;115(48):E11397-E11405.
doi: 10.1073/pnas.1809588115. Epub 2018 Oct 29.

Regulatory discrimination of mRNAs by FMRP controls mouse adult neural stem cell differentiation

Affiliations

Regulatory discrimination of mRNAs by FMRP controls mouse adult neural stem cell differentiation

Botao Liu et al. Proc Natl Acad Sci U S A. .

Abstract

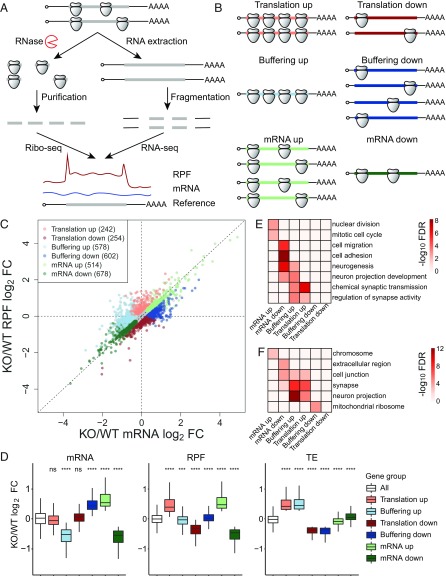
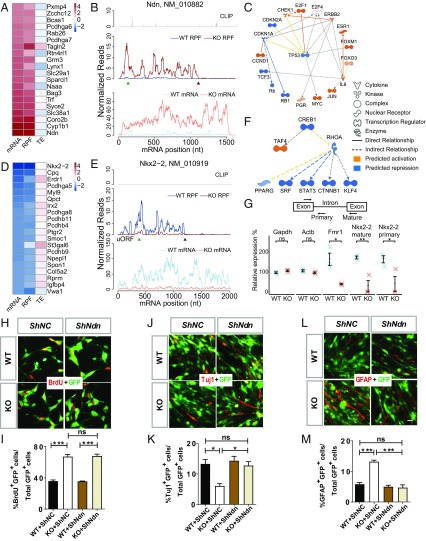
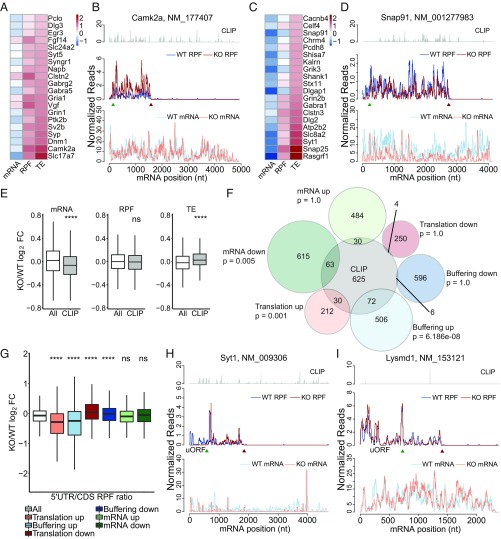
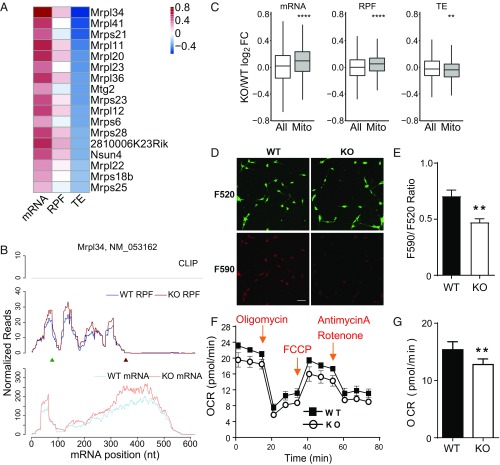
Fragile X syndrome (FXS) is caused by the loss of fragile X mental retardation protein (FMRP), an RNA binding protein whose deficiency impacts many brain functions, including differentiation of adult neural stem cells (aNSCs). However, the mechanism by which FMRP influences these processes remains unclear. Here, we performed ribosome profiling and transcriptomic analysis of aNSCs in parallel from wild-type and Fmr1 knockout mice. Our data revealed diverse gene expression changes at both mRNA and translation levels. Many mitosis and neurogenesis genes were dysregulated primarily at the mRNA level, while numerous synaptic genes were mostly dysregulated at the translation level. Translational "buffering", whereby changes in ribosome association with mRNA are compensated by alterations in RNA abundance, was also evident. Knockdown of NECDIN, an FMRP-repressed transcriptional factor, rescued neuronal differentiation. In addition, we discovered that FMRP regulates mitochondrial mRNA expression and energy homeostasis. Thus, FMRP controls diverse transcriptional and posttranscriptional gene expression programs critical for neural differentiation.

Keywords: fragile X syndrome; neural differentiation; neural stem cells; ribosome profiling; translation.


Conflict of interest statement

The authors declare no conflict of interest.

Figures

Fig. 1.
Fig. 1.
Ribosome profiling reveals diverse changes of gene expression in Fmr1 KO aNSCs. (A) Schematic diagram of the experimental procedures for ribosome profiling. (B) Schematic diagram of six regulatory groups captured by ribosome profiling. (C) Scatter plot of expression changes of mRNA levels and RPFs. Dysregulated mRNAs in the absence of FMRP are classified into six regulatory groups as shown in B; 12,502 genes past filtering are used for the scatter plot. Absolute fold change (FC) > 1.2, nominal P < 0.05, and false discovery rate (FDR) = 0.042 by permutation test. (D) Box plots of expression changes at different levels across six regulatory groups that visualize the medians. The lower and upper hinges correspond to the first and third quartiles. The whiskers extend from the hinges to the largest and smallest values no further than 1.5-fold of interquartile range. Outliers are not shown. Gene expression changes of each regulatory group were compared with those of all genes used for differentially expressed gene analysis (ns, not significant; ***P < 0.001; ****P < 0.0001; Wilcoxon rank sum test after multiple test correction with the Bonferroni method). (E) Top GO terms of biological process enriched in each regulatory group. The enrichment significance (−log10 FDR) is color coded. (F) Top GO terms of cellular component enriched in each regulatory group. See also SI Appendix, Figs. S1 and S2 and Datasets S1–S3.
Fig. 2.
Fig. 2.
Mitosis and neurogenesis genes are dysregulated at the mRNA level in Fmr1 KO aNSCs. (A) Heatmap of expression changes (log2 fold change KO/WT) for the top 20 genes in the mRNA up group. (B) Read distributions on the Ndn gene of mRNA up group. FMRP CLIP tags (Top) (13) and normalized RPF reads (Middle) and mRNA reads (Bottom) averaged across all replicates are plotted along the mRNA nucleotide positions, with green and red triangles for annotated start and stop codons, respectively. (C) Transformation-related protein 53 (TP53) upstream network of increased mRNAs predicted by IPA. (D) Heatmap of expression changes (log2 fold change KO/WT) for the top 20 genes in the mRNA down group. (E) Read distributions on the Nkx2-2 gene of mRNA down group. (F) cAMP responsive element binding protein 1 (CREB1) upstream network of decreased mRNAs predicted by IPA. (G, Top) Schematic diagram of the primer design to measure the abundance of primary and mature transcripts. (G, Bottom) qPCR validation of mRNA changes for selected genes. Data are presented as mean ± SEM (n = 3; ns, not significant; *P < 0.05; **P < 0.01; two-tailed Student’s t test). (H) Acute knockdown of Ndn by shNdn did not affect the proliferation rate of Fmr1 KO aNSCs as assessed by BrdU incorporation under proliferating conditions followed by quantitative analysis (I). (J) Acute knockdown of Ndn by shNdn rescued neuronal differentiation phenotypes of Fmr1 KO aNSCs as assessed by β-tubulin III (Tuj1; a neuronal marker) followed by quantitative analysis (K). (L) Acute knockdown of Ndn using shNdn rescued astroglial differentiation phenotypes of Fmr1 KO aNSCs as assessed by glial fibrillary acidic protein (GFAP; an astroglial marker) followed by quantitative analysis (M). (H, J, and L) Red for BrdU, Tuj1, or GFAP; green for shNdn or shNC viral-infected cells. (Scale bar, 20 µm.) (I, K, and M) n = 3; ns, not significant; *P < 0.05; ***P < 0.001; two-way ANOVA. Data are presented as mean ± SEM. See also SI Appendix, Fig. S3.
Fig. 3.
Fig. 3.
FMRP CLIP targets have increased TEs in Fmr1 KO aNSCs. (A) Heatmap of expression changes [log2 fold change (FC) KO/WT] for the top 20 synaptic genes in the translation up group. (B) Read distributions on the calcium/calmodulin-dependent protein kinase II alpha (Camk2a) gene of translation up group. (C) Heatmap of expression changes (log2FC KO/WT) for the top 20 synaptic genes in the buffering up group. (D) Read distributions on the synaptosomal-associated protein 91 (Snap91) gene of buffering up group. (E) Box plots of expression changes at different levels for FMRP CLIP targets compared with those of all genes used for differentially expressed gene (DEG) analysis (ns, not significant; ****P < 0.0001; Wilcoxon rank sum test after multiple test correction with the Bonferroni method). CLIP genes are top FMRP targets identified in ref. . (F) Overlap between FMRP CLIP genes and genes in each regulatory group. Statistical significance is calculated with a hypergeometric test with the Bonferroni correction. See also SI Appendix, Table S2. (G) Box plots of changes of 5′ UTR/CDS read ratios in different regulatory groups compared with those of all genes used for DEG analysis (ns, not significant; ***P < 0.001; ****P < 0.0001; Wilcoxon rank sum test after multiple test correction with the Bonferroni method). (H) Read distributions on the synaptotagmin I (Syt1) gene with decreased 5′ UTR/CDS ratio. (I) Read distributions on the LysM and putative peptidoglycan-binding domain-containing 1 (Lysmd1) gene with increased 5′ UTR/CDS ratio. See also SI Appendix, Fig. S4.
Fig. 4.
Fig. 4.
Compromised expression of nuclear-encoded mitochondrial protein mRNAs is correlated with disturbed energy homeostasis in Fmr1 KO aNSCs. (A) Heatmap of expression changes [log2 fold change (FC) KO/WT] for mitochondrial ribosomal protein mRNAs in the buffering down group. (B) Read distributions on the mitochondrial ribosomal protein L34 (Mrpl34) gene of buffering down group. (C) Box plots of expression changes at different levels for nuclear-encoded mitochondrial protein mRNAs compared with those of all genes used for differentially expressed gene analysis (**P < 0.01; ****P < 0.0001; Wilcoxon rank sum test after multiple test correction with the Bonferroni method). “Mito” genes are selected based on the MitoCarta2.0 database (27). (D and E) JC-10 assay and quantification of mitochondrial membrane potential in WT and Fmr1 KO aNSCs. (D) aNSCs were stained with JC-10 solution for 30 min at 37 °C. (Scale bar, 20 µm.) (E) The mitochondrial membrane potential was assessed by quantifying the ratio between intensity of red fluorescence (590 nm) and green fluorescence (520 nm). n = 3; **P < 0.01; Student’s t test was used for data analyses. Data are presented as mean ± SEM. (F and G) Bioenergetic profile of aNSCs by using an Agilent Seahorse XF-24 Analyzer. The OCR is measured before the addition of drugs (basal OCR) and then after the addition of the indicated drugs: Oligomycin is an ATP synthase inhibitor, and the reduction in OCR after oligomycin indicates the amount of O2 consumed for mitochondrial ATP generation. Carbonyl cyanide-p-trifluoromethoxyphenylhydrazone (FCCP) uncouples ATP synthesis from the electron transport chain (ETC). After FCCP, the maximum capacity of the mitochondria to use oxidative phosphorylation (maximal OCR) is revealed. Rotenone (complex I inhibitor) and antimycin A (complex III inhibitor) together render a complete shutdown of the ETC. Spare respiratory capacity is the difference between maximal OCR and basal OCR and, as such, is an indicator of how close to its bioenergetic limit the cell is functioning (47). n = 3; **P < 0.01; Student’s t test was used for data analyses. Data are presented as mean ± SEM.

Comment in

References

    1. Santoro MR, Bray SM, Warren ST. Molecular mechanisms of fragile X syndrome: A twenty-year perspective. Annu Rev Pathol. 2012;7:219–245. - PubMed
    1. Nelson DL, Orr HT, Warren ST. The unstable repeats–Three evolving faces of neurological disease. Neuron. 2013;77:825–843. - PMC - PubMed
    1. Darnell JC, Klann E. The translation of translational control by FMRP: Therapeutic targets for FXS. Nat Neurosci. 2013;16:1530–1536. - PMC - PubMed
    1. Frazier TW, et al. Molecular and phenotypic abnormalities in individuals with germline heterozygous PTEN mutations and autism. Mol Psychiatry. 2015;20:1132–1138. - PMC - PubMed
    1. Auerbach BD, Osterweil EK, Bear MF. Mutations causing syndromic autism define an axis of synaptic pathophysiology. Nature. 2011;480:63–68. - PMC - PubMed

Publication types

MeSH terms

Substances