

Metabolomes of mitochondrial diseases and inclusion body myositis patients: treatment targets and biomarkers
- PMID: 30373890
- PMCID: PMC6284386
- DOI: 10.15252/emmm.201809091
Metabolomes of mitochondrial diseases and inclusion body myositis patients: treatment targets and biomarkers
Abstract
Mitochondrial disorders (MDs) are inherited multi-organ diseases with variable phenotypes. Inclusion body myositis (IBM), a sporadic inflammatory muscle disease, also shows mitochondrial dysfunction. We investigated whether primary and secondary MDs modify metabolism to reveal pathogenic pathways and biomarkers. We investigated metabolomes of 25 mitochondrial myopathy or ataxias patients, 16 unaffected carriers, six IBM and 15 non-mitochondrial neuromuscular disease (NMD) patients and 30 matched controls. MD and IBM metabolomes clustered separately from controls and NMDs. MDs and IBM showed transsulfuration pathway changes; creatine and niacinamide depletion marked NMDs, IBM and infantile-onset spinocerebellar ataxia (IOSCA). Low blood and muscle arginine was specific for patients with m.3243A>G mutation. A four-metabolite blood multi-biomarker (sorbitol, alanine, myoinositol, cystathionine) distinguished primary MDs from others (76% sensitivity, 95% specificity). Our omics approach identified pathways currently used to treat NMDs and mitochondrial stroke-like episodes and proposes nicotinamide riboside in MDs and IBM, and creatine in IOSCA and IBM as novel treatment targets. The disease-specific metabolic fingerprints are valuable "multi-biomarkers" for diagnosis and promising tools for follow-up of disease progression and treatment effect.
Keywords: biomarker; inclusion body myositis; metabolomics; mitochondrial diseases.
© 2018 The Authors. Published under the terms of the CC BY 4.0 license.
Figures
- A–D
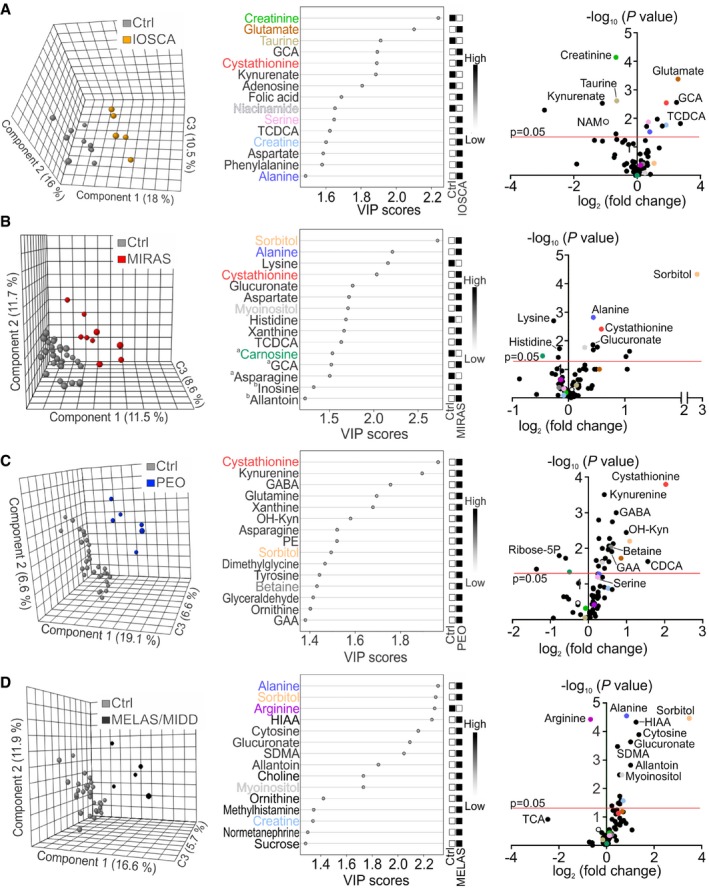
Clustering of metabolome data in patients and controls; PLS‐DA plots; VIP score plots of top 15 metabolites; volcano plots of all metabolites in blood of IOSCA (A), MIRAS (B), PEO (C), and MELAS/MIDD (D). aSignificantly changed metabolites outside the FDR cut‐off. bMetabolites not significantly changed between patients and controls. Colours in VIP score and volcano plots indicate the same most relevant and/or significantly changed metabolites among all patient groups. C3, component 3; CDCA, chenodeoxycholic acid; GABA, γ‐aminobutyric acid; HIAA, 5‐hydroxyindole‐3‐acetic acid; OH‐Kyn, 3‐hydroxy‐DL‐kynurenine; SDMA, symmetric dimethylarginine; TCA, taurocholic acid. See Dataset EV2 for raw data.
- A–C
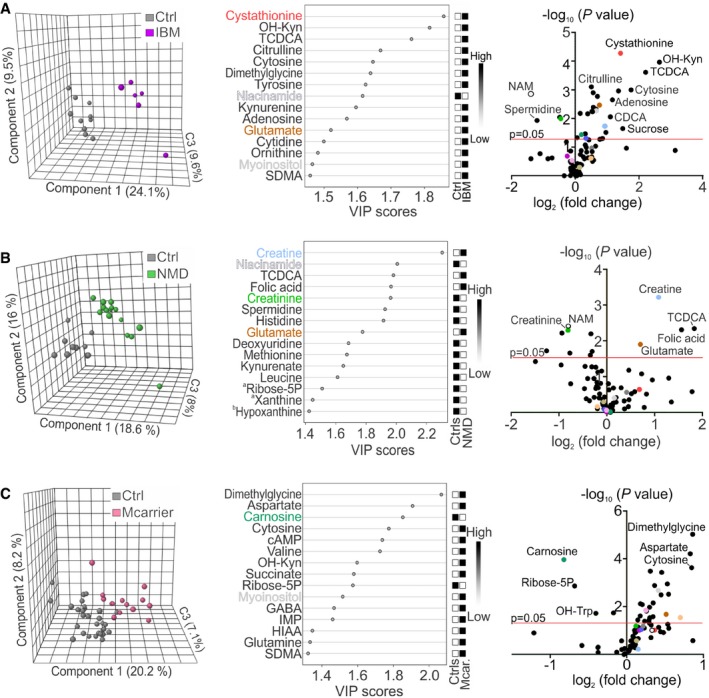
Clustering of metabolome data in patients and controls; PLS‐DA plots; VIP score plots of top 15 metabolites; volcano plots of all metabolites in blood of IBM (A), NMD patients (B) and MIRAS carriers (C). aSignificantly changed metabolites outside the FDR cut‐off. bMetabolites not significantly changed between patients and controls. Colours in VIP score and volcano plots indicate the same most relevant and/or significantly changed metabolites among all patient groups. cAMP, cyclic AMP; C3, component 3; CDCA, chenodeoxycholic acid; GABA, γ‐aminobutyric acid; HIAA, 5‐hydroxyindole‐3‐acetic acid; IMP, inosine monophosphate; OH‐Kyn, 3‐hydroxy‐DL‐kynurenine; OH‐Trp, hydroxytryptophan; SDMA, symmetric dimethylarginine. See Dataset EV2 for raw data.
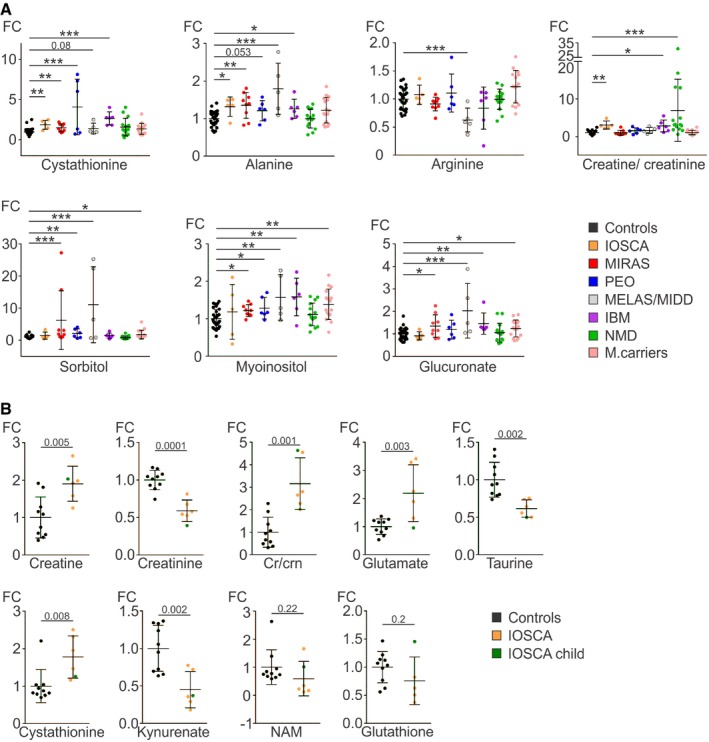
Relative values of single metabolites and creatine/creatinine ratios in blood of primary MD, IBM and NMD patients, and MIRAS carriers compared to controls.
Relative values of single metabolites in blood of adult IOSCA (marked “IOSCA”) patients and one IOSCA child patient compared to controls.
- A, B
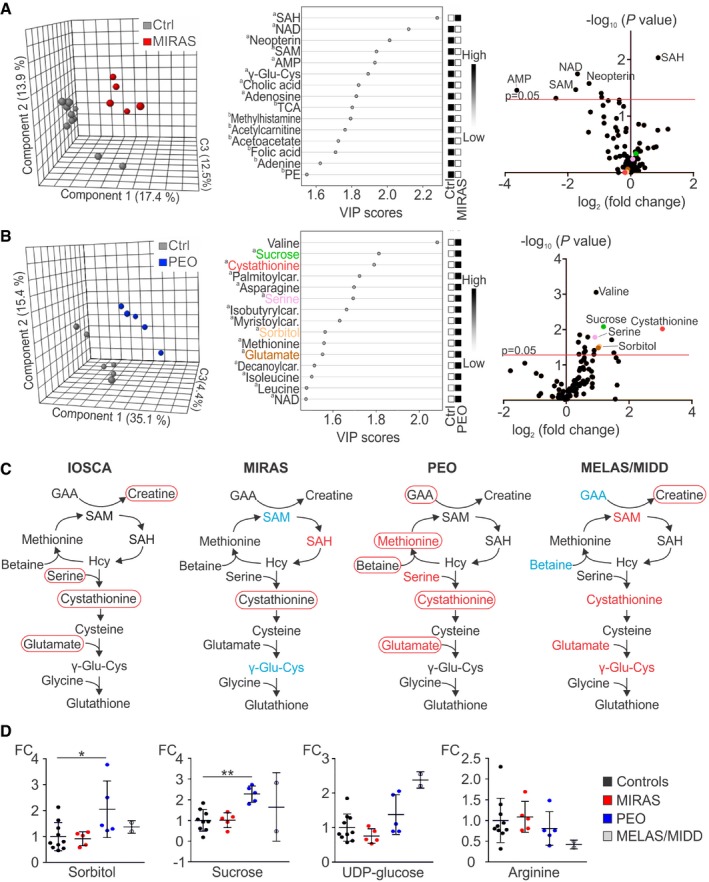
Metabolomes of muscle of MIRAS (A) and PEO (B) patients; PLS‐DA plots; VIP score plots of top 15 metabolites; volcano plots of all metabolites.
- C
Methyl cycle, transsulfuration and glutathione biosynthesis pathways changed in IOSCA, MIRAS, PEO and MELAS/MIDD patients. Circled text: metabolites changed in blood; red, increased; blue, decreased. Coloured text: metabolites changed in muscle; red, increased; blue, decreased. Selected for MELAS muscle were metabolites with the highest fold change.
- D
Relative values of metabolites in muscle of MIRAS, PEO and MELAS/MIDD patients compared to controls.
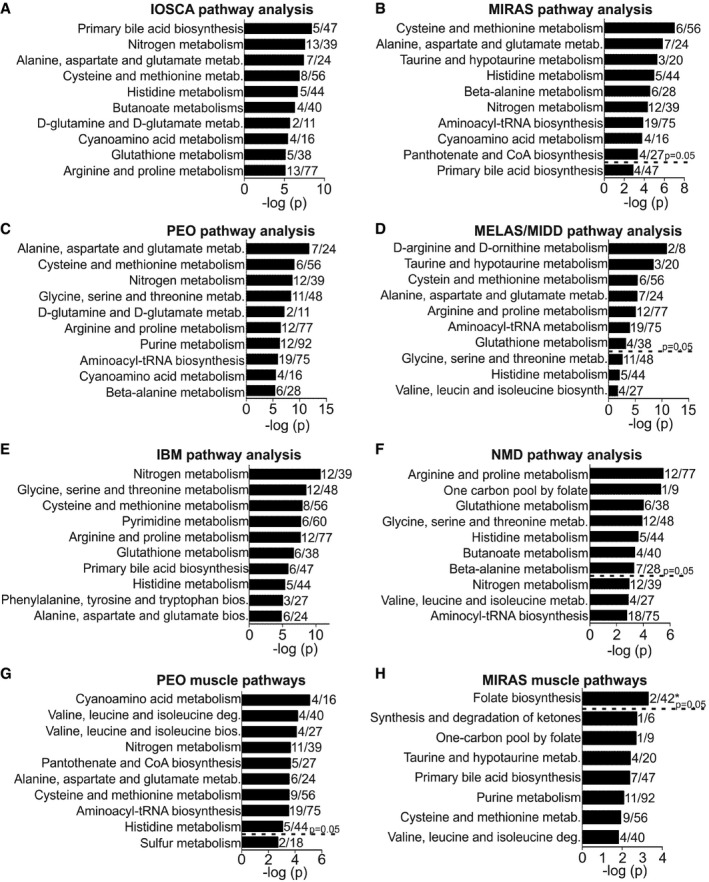
- A–F
Changed metabolic pathways in blood of IOSCA (A), MIRAS (B), PEO (C), MELAS/MIDD (D), IBM (E) and NMD (F) patients.
- G, H
Changed metabolic pathways in muscle of PEO (G) and MIRAS (H) patients.
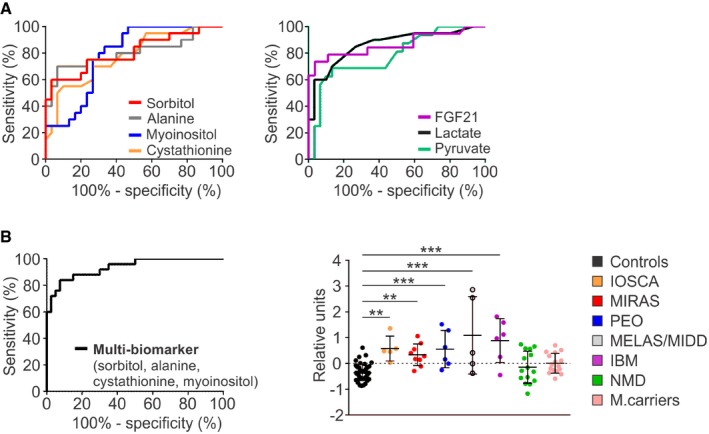
ROC curves for individual metabolites sorbitol, alanine, myoinositol and cystathionine (left) and conventional blood biomarkers lactate and pyruvate, and cytokine FGF21 (right) in blood of MIRAS, PEO and MELAS/MIDD patients (n = 20) compared to controls (n = 30).
ROC curve for the combined “multi‐biomarker” of sorbitol/alanine/myoinositol/cystathionine for primary MDs compared to controls (left); mean centroids for MD, IBM and NMD patients, and MIRAS carriers compared to controls (right).
Volcano plot of all the blood metabolites of male (n = 14) and female (n = 16) controls. Colours in the volcano plot indicate the same most relevant and/or significantly changed metabolites as in Figs 1 and 2.
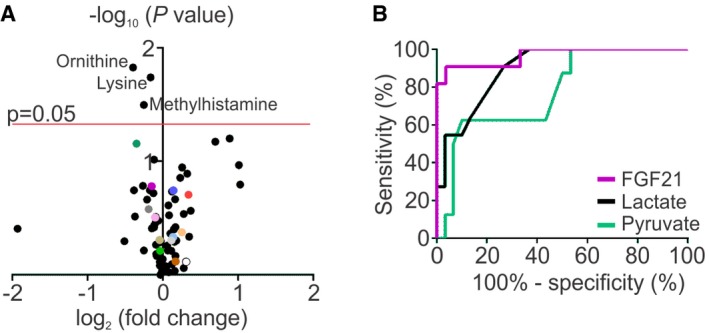
ROC curves for conventional biomarkers in blood of muscle‐manifesting PEO and MELAS/MIDD patients (n = 11) compared to controls (n = 30).
References
-
- Abdullah M, Kornegay J, Honcoop A, Parry T, Balog‐Alvarez C, O'Neal S, Bain J, Muehlbauer M, Newgard C, Patterson C et al (2017) Non‐targeted metabolomics analysis of golden retriever muscular dystrophy‐affected muscles reveals alterations in arginine and proline metabolism, and elevations in glutamic and oleic acid in vivo . Metabolites 7: 38 - PMC - PubMed
-
- Askanas V, Engel WK, Nogalska A (2015) Sporadic inclusion‐body myositis: a degenerative muscle disease associated with aging, impaired muscle protein homeostasis and abnormal mitophagy. Biochim Biophys Acta 1852: 633–643 - PubMed
-
- Brownlee M (2001) Biochemistry and molecular cell biology of diabetic complications. Nature 414: 813–820 - PubMed
Publication types
MeSH terms
Substances
LinkOut - more resources
Full Text Sources
Other Literature Sources
Medical
Research Materials
Miscellaneous
