. 2018 Oct 29;9(1):4496.
doi: 10.1038/s41467-018-06714-z.

Homeostasis of protein and mRNA concentrations in growing cells

Affiliations

Homeostasis of protein and mRNA concentrations in growing cells

Jie Lin et al. Nat Commun. .

Abstract

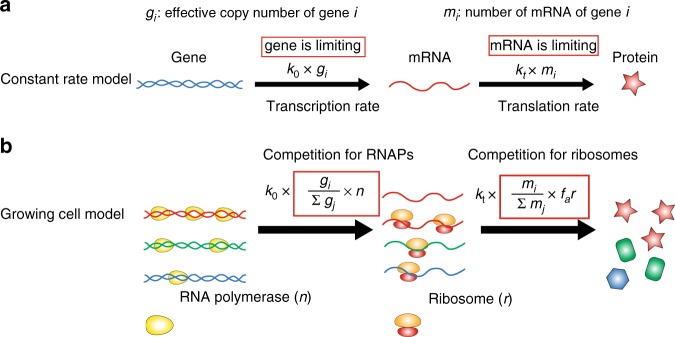
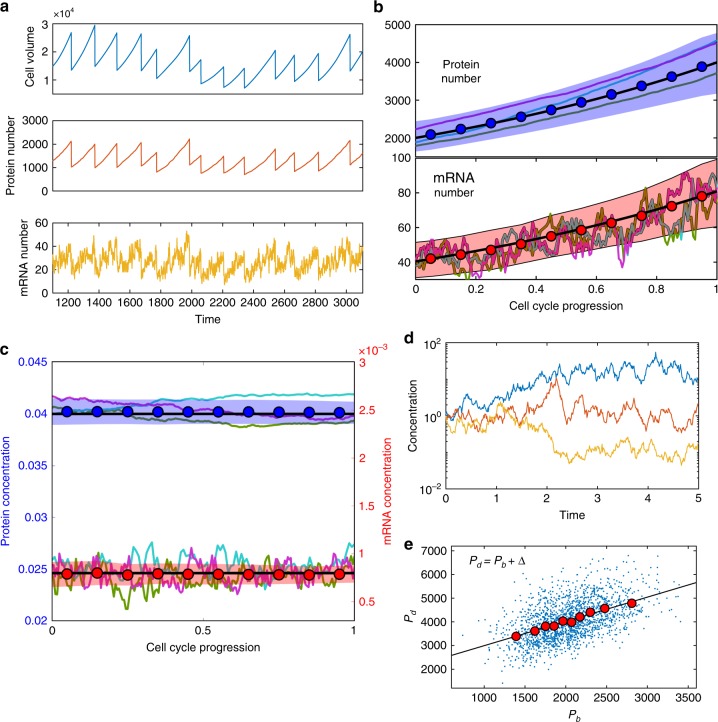
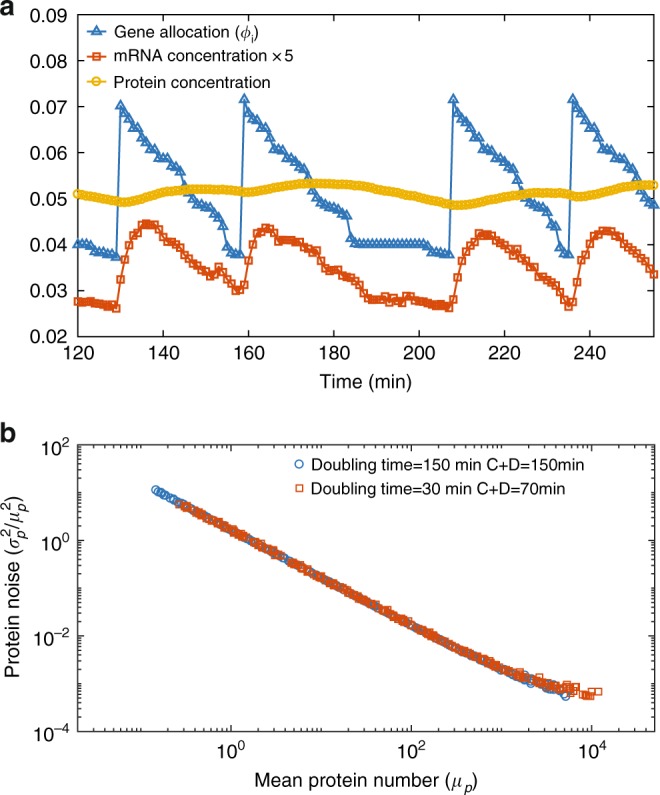
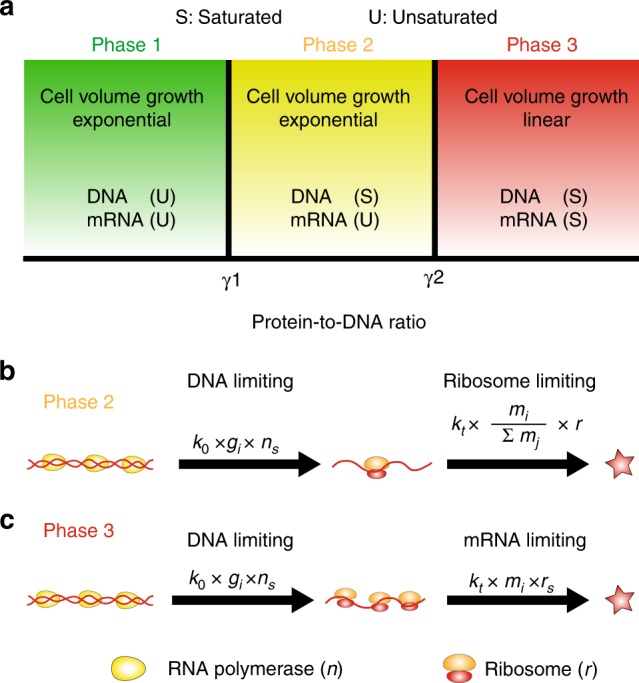
Many experiments show that the numbers of mRNA and protein are proportional to the cell volume in growing cells. However, models of stochastic gene expression often assume constant transcription rate per gene and constant translation rate per mRNA, which are incompatible with these experiments. Here, we construct a minimal gene expression model to fill this gap. Assuming ribosomes and RNA polymerases are limiting in gene expression, we show that the numbers of proteins and mRNAs both grow exponentially during the cell cycle and that the concentrations of all mRNAs and proteins achieve cellular homeostasis; the competition between genes for the RNA polymerases makes the transcription rate independent of the genome number. Furthermore, by extending the model to situations in which DNA (mRNA) can be saturated by RNA polymerases (ribosomes) and becomes limiting, we predict a transition from exponential to linear growth of cell volume as the protein-to-DNA ratio increases.


Conflict of interest statement

The authors declare no competing interests.

Figures

Fig. 1
Fig. 1
The growing cell model of stochastic gene expression in comparison with constant rate models. a In the constant rate model, the transcription rate is proportional to the gene copy number, and the translation rate is proportional to the mRNA number. These assumptions imply that the gene number and mRNA number are the limiting factors in gene expression. b In Phase 1 of the growing cell model, we introduce as limiting factors RNA polymerases (RNAPs) and ribosomes. Genes with different colors are transcribed with different rates. Here k0 is a constant and the gene regulation is coarse-grained into the gene allocation fraction ϕi=gijgj. gi is the effective copy number of gene i (also accounting for the promoter strength). n is the total number of RNAPs. Translation rates of mRNA depend on the number of active ribosomes (far), the translation rate kt, and the fraction of mRNA i in the total pool of mRNA. In a later section (A unified phase diagram of gene expression and cellular growth), we will relax our assumptions and consider situations in which the limiting factors of gene expression become the gene number and the mRNA number
Fig. 2
Fig. 2
Exponential growth of the cell volume, protein number, mRNA number; the homeostasis of protein and mRNA concentrations throughout the cell cycle. a Numerical simulated trajectories of cell volume, protein number, and mRNA number are shown (ϕi = 0.018). b The averaged values of protein and mRNA numbers of a highly expressed gene (ϕi = 0.04), are shown (circles) with 3 single trajectories in the background. The black lines are theoretical predictions of Eqs. (6a) and (6b). The average is over 130 cell cycles. The color band represents the standard deviation (same for (c)). c The averaged values of protein and mRNA concentrations of the same gene as in (b) are shown (circles). The black lines are theoretical predictions of Eqs. (7a) and (7b). Three trajectories are shown in the background. d Three trajectories of diverging concentrations in the scenario where the protein number and cell volume grow independently. See the numerical details in Methods. e The scatter plot of the protein numbers at cell division (Pd) v.s. the protein numbers at cell birth (Pb). The circles are binned data. The black line is a linear fit of the binned data with slope 1.03, consistent with the adder correlations
Fig. 3
Fig. 3
Effects of finite duration of DNA replication. a The time trajectory of gene allocation fraction (triangles), mRNA concentration (squares) and protein concentration (circles) of a high copy number protein (μp ≈ 104, see (b)). The doubling time is T = 30 min, and we use the values of the C and D periods from ref., namely, C = 35 min and D = 35 min. In this situation, the cell undergoes DNA replication throughout the cell cycle. Nevertheless, the noise in ϕi does not propagate to the noise in protein concentration significantly. The value of mRNA concentration is 5 times amplified for clarity. b An exponentially growing population is simulated (See Methods). The noise magnitude is quantified as the square of CV of protein concentrations. The mean protein number (μp) is the protein number per average cell volume. Gene dosage effects due to DNA replication do not generate a significant global extrinsic noise. Two different doubling times are considered
Fig. 4
Fig. 4
Phases of gene expression and cell volume growth. a Theoretical phase diagram of gene expression and cellular growth within our model. The x axis is the protein-to-DNA ratio (γ). When γ < γ1, neither DNA nor mRNA is saturated. The mRNA number, the protein number and the cell volume all grow exponentially with the growth rate set by the fraction of ribosomal gene in the total genome (ϕr). When γ1 < γ < γ2, DNA is saturated but mRNA is not. The protein number and the cell volume still grow exponentially while the mRNA number is a constant proportional to the gene number. When γ > γ2, both DNA and mRNA are saturated. The protein number and cell volume grow linearly, and the cell volume growth rate is set by the genome copy number. b The gene expression dynamics in phase 2. In this phase, DNA is saturated by RNAPs, therefore, the transcription rate is proportional to the effective gene copy number, gi. ns is the upper bound of the number of RNAPs that can work on one gene simultaneously. The translation rate is the same as in phase 1. To simplify the formula, we assume all ribosomes are active (to include the effect of an inactive fraction, r should be replaced by far). c The gene expression dynamics in phase 3, in which both DNA and mRNA are saturated. The translation rate is proportional to the mRNA number. rs is the upper bound of the number of ribosomes that can work on one mRNA simultaneously

References

    1. Paulsson J. Models of stochastic gene expression. Phys. Life Rev. 2005;2:157–175. doi: 10.1016/j.plrev.2005.03.003. - DOI
    1. Kærn M, Elston TC, Blake WJ, Collins JJ. Stochasticity in gene expression: from theories to phenotypes. Nat. Rev. Genet. 2005;6:451–464. doi: 10.1038/nrg1615. - DOI - PubMed
    1. Pedraza JM, van Oudenaarden A. Noise propagation in gene networks. Science. 2005;307:1965–1969. doi: 10.1126/science.1109090. - DOI - PubMed
    1. Raj A, van Oudenaarden A. Nature, nurture, or chance: stochastic gene expression and its consequences. Cell. 2008;135:216–226. doi: 10.1016/j.cell.2008.09.050. - DOI - PMC - PubMed
    1. Thattai M, Van Oudenaarden A. Intrinsic noise in gene regulatory networks. Proc. Natl Acad. Sci. 2001;98:8614–8619. doi: 10.1073/pnas.151588598. - DOI - PMC - PubMed

Publication types