

Reference-point centering and range-adaptation enhance human reinforcement learning at the cost of irrational preferences
- PMID: 30374019
- PMCID: PMC6206161
- DOI: 10.1038/s41467-018-06781-2
Reference-point centering and range-adaptation enhance human reinforcement learning at the cost of irrational preferences
Abstract
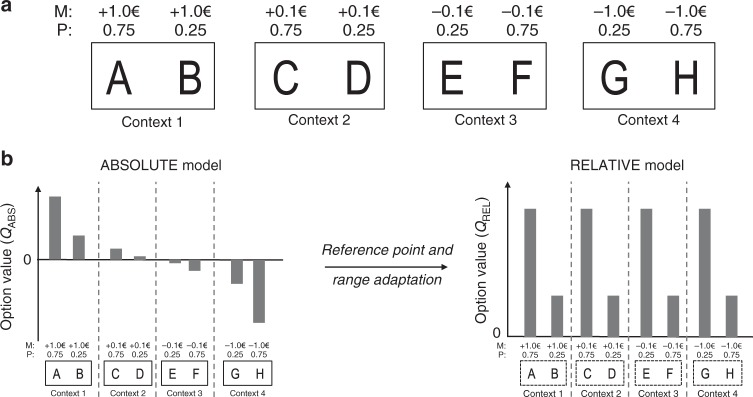
In economics and perceptual decision-making contextual effects are well documented, where decision weights are adjusted as a function of the distribution of stimuli. Yet, in reinforcement learning literature whether and how contextual information pertaining to decision states is integrated in learning algorithms has received comparably little attention. Here, we investigate reinforcement learning behavior and its computational substrates in a task where we orthogonally manipulate outcome valence and magnitude, resulting in systematic variations in state-values. Model comparison indicates that subjects' behavior is best accounted for by an algorithm which includes both reference point-dependence and range-adaptation-two crucial features of state-dependent valuation. In addition, we find that state-dependent outcome valuation progressively emerges, is favored by increasing outcome information and correlated with explicit understanding of the task structure. Finally, our data clearly show that, while being locally adaptive (for instance in negative valence and small magnitude contexts), state-dependent valuation comes at the cost of seemingly irrational choices, when options are extrapolated out from their original contexts.
Conflict of interest statement
The authors declare no competing interests.
Figures
Similar articles
-
The actor-critic learning is behind the matching law: matching versus optimal behaviors.Neural Comput. 2008 Jan;20(1):227-51. doi: 10.1162/neco.2008.20.1.227. Neural Comput. 2008. PMID: 18045007
-
Opponent Identity Influences Value Learning in Simple Games.J Neurosci. 2015 Aug 5;35(31):11133-43. doi: 10.1523/JNEUROSCI.3530-14.2015. J Neurosci. 2015. PMID: 26245974 Free PMC article.
-
Reinforcement learning signals in the human striatum distinguish learners from nonlearners during reward-based decision making.J Neurosci. 2007 Nov 21;27(47):12860-7. doi: 10.1523/JNEUROSCI.2496-07.2007. J Neurosci. 2007. PMID: 18032658 Free PMC article.
-
Neural basis of reinforcement learning and decision making.Annu Rev Neurosci. 2012;35:287-308. doi: 10.1146/annurev-neuro-062111-150512. Epub 2012 Mar 29. Annu Rev Neurosci. 2012. PMID: 22462543 Free PMC article. Review.
-
[Mathematical models of decision making and learning].Brain Nerve. 2008 Jul;60(7):791-8. Brain Nerve. 2008. PMID: 18646619 Review. Japanese.
Cited by
-
Decision neuroscience and neuroeconomics: Recent progress and ongoing challenges.Wiley Interdiscip Rev Cogn Sci. 2022 May;13(3):e1589. doi: 10.1002/wcs.1589. Epub 2022 Feb 8. Wiley Interdiscip Rev Cogn Sci. 2022. PMID: 35137549 Free PMC article. Review.
-
Context-sensitive valuation and learning.Curr Opin Behav Sci. 2021 Oct;41:122-127. doi: 10.1016/j.cobeha.2021.05.001. Epub 2021 Jun 9. Curr Opin Behav Sci. 2021. PMID: 34222566 Free PMC article.
-
Social inequity disrupts reward-based learning.Commun Psychol. 2025 Aug 16;3(1):125. doi: 10.1038/s44271-025-00300-y. Commun Psychol. 2025. PMID: 40819098 Free PMC article.
-
Adaptation of utility functions to reward distribution in rhesus monkeys.Cognition. 2021 Sep;214:104764. doi: 10.1016/j.cognition.2021.104764. Epub 2021 May 14. Cognition. 2021. PMID: 34000666 Free PMC article.
-
Contextual influence on confidence judgments in human reinforcement learning.PLoS Comput Biol. 2019 Apr 8;15(4):e1006973. doi: 10.1371/journal.pcbi.1006973. eCollection 2019 Apr. PLoS Comput Biol. 2019. PMID: 30958826 Free PMC article.
References
-
- Sutton RS, Barto AG. Reinforcement learning: an introduction. IEEE Trans. Neural Netw. 1998;9:1054–1054. doi: 10.1109/TNN.1998.712192. - DOI
-
- Rescorla RA, Wagner AR. A theory of Pavlovian conditioning: variations in the effectiveness of reinforcement and nonreinforcement. Class. Cond. II Curr. Res. Theory. 1972;2:64–99.
Publication types
MeSH terms
Grants and funding
LinkOut - more resources
Full Text Sources
