

Comment
doi: 10.1038/s41588-018-0217-6.
Currently available bulk sequencing data do not necessarily support a model of neutral tumor evolution
Affiliations
- PMID: 30374067
- PMCID: PMC6467055
- DOI: 10.1038/s41588-018-0217-6
Item in Clipboard
Comment
Currently available bulk sequencing data do not necessarily support a model of neutral tumor evolution
Nat Genet.
2018 Dec.
No abstract available
Conflict of interest statement
Conflict of interest:
All authors wrote the manuscript.
Figures
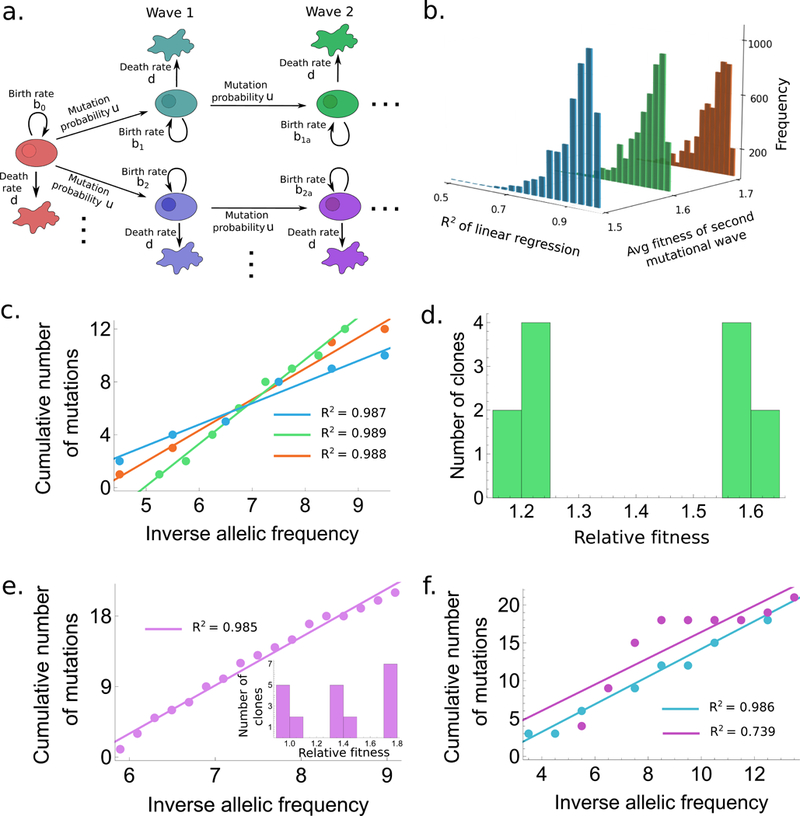
(a.) Schematic representation for the accumulation of mutations in our model. (b.) Histogram of R2 values for the model with two mutational waves. Fitness values are as follows: type-0 : 0.9, type-i : 1+N(0.2, 0.012), type-ia : 1+N( with (blue), 0.6 (green), 0.7 (orange). Histograms are generated from 5000 draws from N(). (c.) One example draw with R2 > 0.985 from each of the three cases in (b.) are shown with corresponding color codes. (d.) Fitness distribution of the clones corresponding to (corresponding to green in (b.) and (c.)). (e.),(f.) Same as (c.),(d.) but with three waves of mutations. Fitness values in (f.) were chosen from a log-normal distribution with same parameters as (e.). The total size of the tumor in all cases is allowed to reach anywhere between 6×10⁷ to 7×10¹¹ cells.
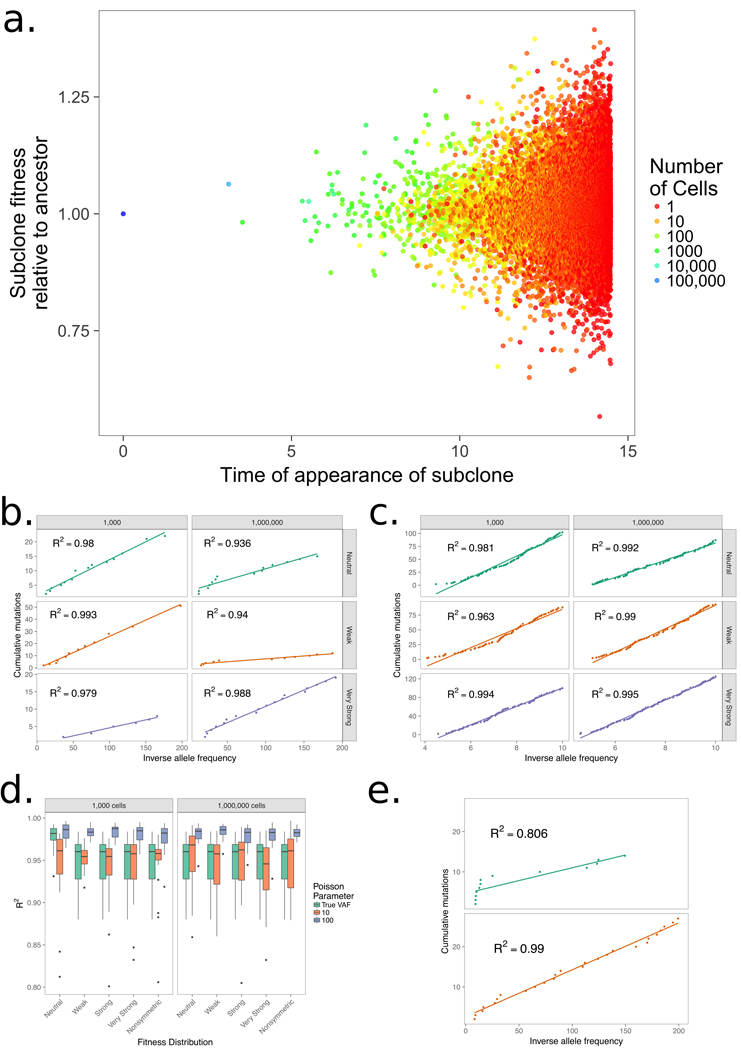
We initiate each process with a single ancestor with birth rate of 1, a death rate of 0.1, and a double exponential fitness distribution with mean fitness change of 0.01 (weak), 0.04 (strong), and 1 (very strong) along with a neutral evolution model where there is no change in fitness and a model with only increasing fitness changes. (a.), The panel shows the time of a new subclone’s appearance with the birth rate colored by the subclone’s size at the end of the simulation, showing that the subclone size in a simulation with strong selection is associated with age, but also with its fitness. Allowing the simulation to run longer would result in younger subclones with high fitness outcompeting older ones. (b.) A plot of the cumulative number of mutations (M) and inverse allele frequency (1/f) shows linear trends in simulations where a single mutation arises from any mutation event and no additional noise is added to mimic the effect of sequencing. (c.) A linear trend is apparent between M and 1/f in the same model where each new mutation event contains Poisson(100) mutations and alleles are sampled to account for sequencing errors to create a result that follows the methods of Williams et al.
(d.) Boxplots for 25 simulation in all models for 1,000 and 1,000,000 cells show there is little change in R2 as selection becomes larger, but allowing multiple mutations to occur at any mutation event has a large effect on linearity. (e.) The model is able to recapitulate nonlinear curves suggesting the models with selection do not necessarily result in linear curves, but can result in both types.
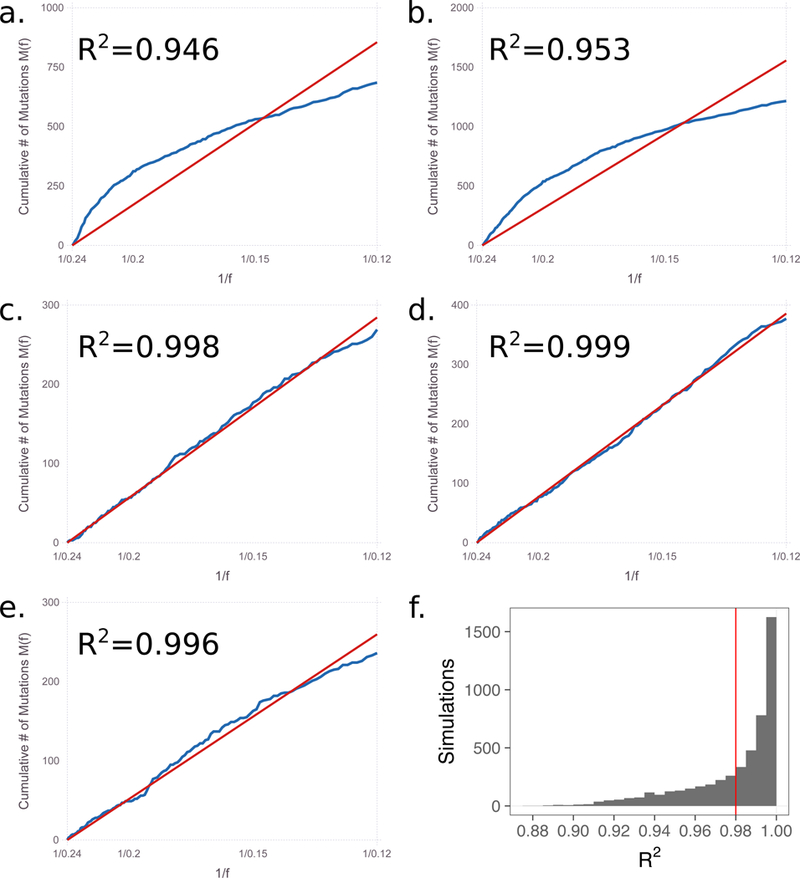
Using the code provided by Williams et al. for situations with selection, we show that linearity between the cumulative mutation count and inverse allele frequency is widespread. We used the code with different seed values than provided by the authors to initiate the random number generator. (a.) seed = 5 (provided); (b.) seed = 7 (provided); (c.) seed = 2; (d.) seed = 911; (e.) seed = 1234. (f.) a histogram of the R2 for 5,000 runs of the code.
Comment in
-
Reply to 'Currently available bulk sequencing data do not necessarily support a model of neutral tumor evolution'.Nat Genet. 2018 Dec;50(12):1624-1626. doi: 10.1038/s41588-018-0235-4. Nat Genet. 2018. PMID: 30374070 No abstract available.
Comment on
-
Identification of neutral tumor evolution across cancer types.Nat Genet. 2016 Mar;48(3):238-244. doi: 10.1038/ng.3489. Epub 2016 Jan 18. Nat Genet. 2016. PMID: 26780609 Free PMC article.
References
Publication types
MeSH terms
Grants and funding
LinkOut - more resources
Full Text Sources
