. 2018 Oct 29;8(1):15970.
doi: 10.1038/s41598-018-34361-3.

Disease networks identify specific conditions and pleiotropy influencing multimorbidity in the general population

Affiliations

Disease networks identify specific conditions and pleiotropy influencing multimorbidity in the general population

A Amell et al. Sci Rep. .

Abstract

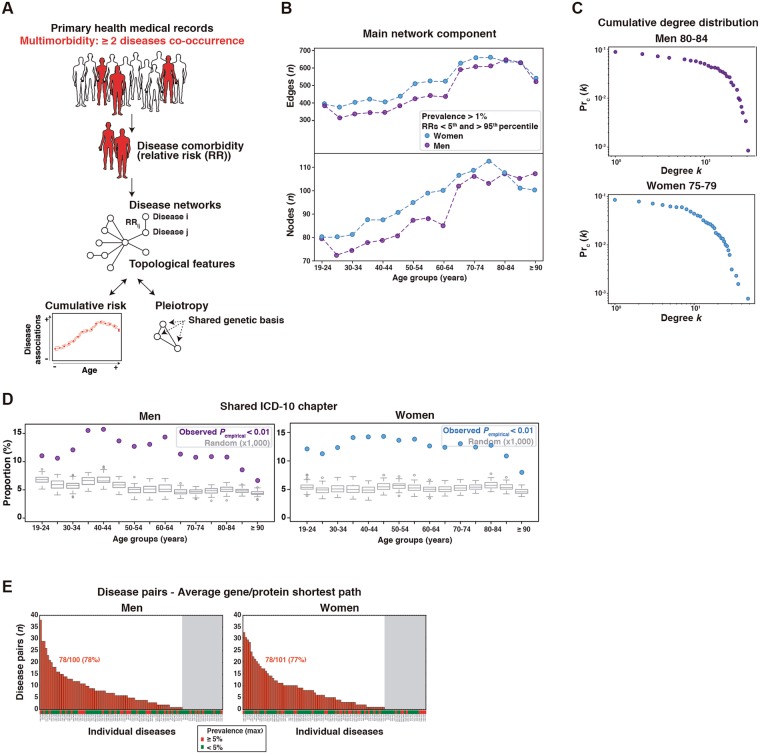
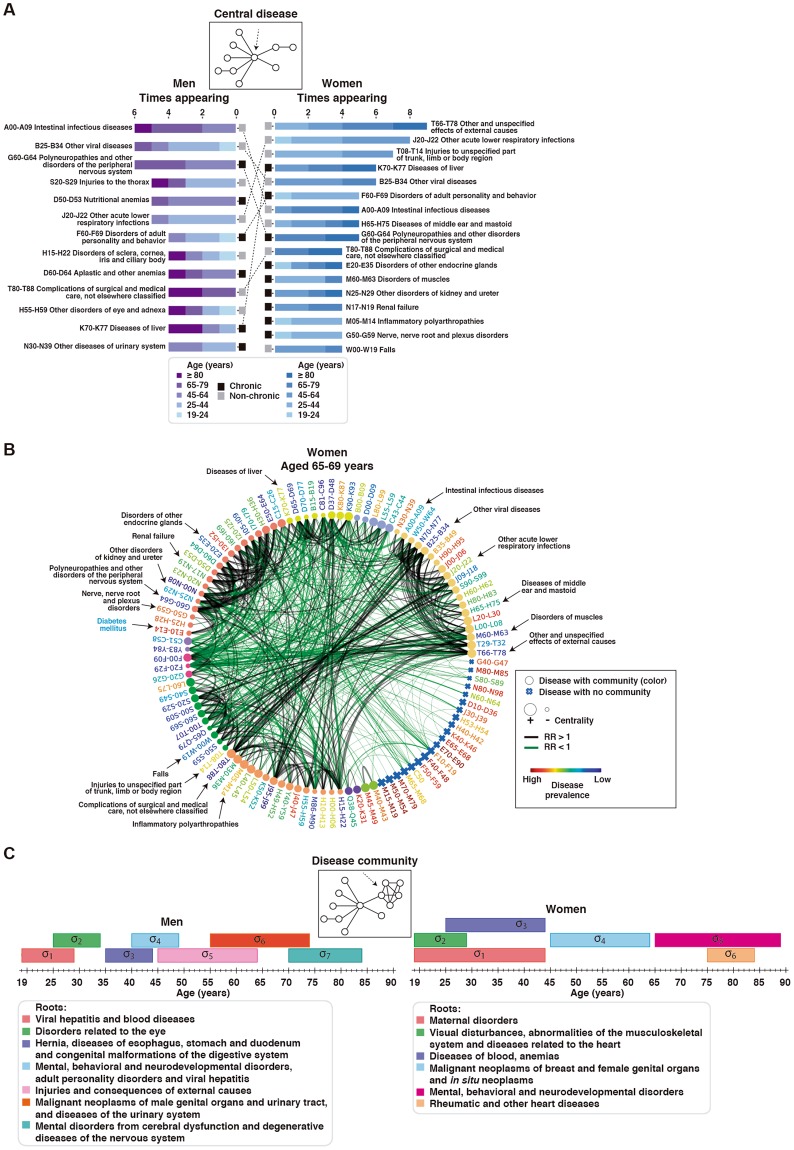
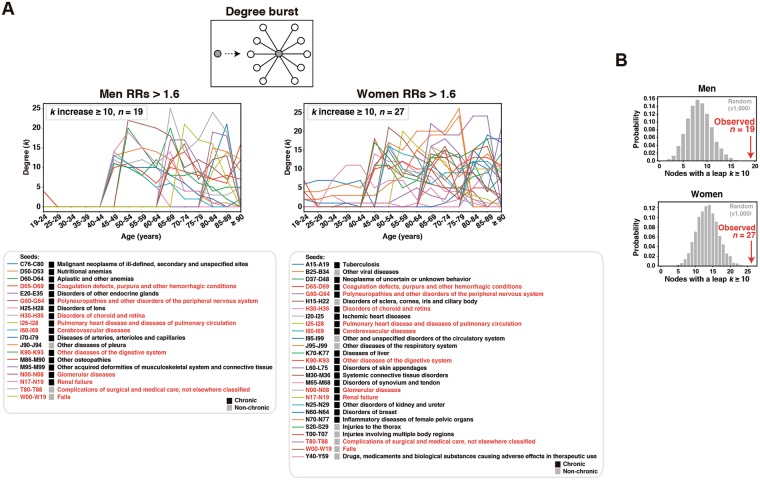
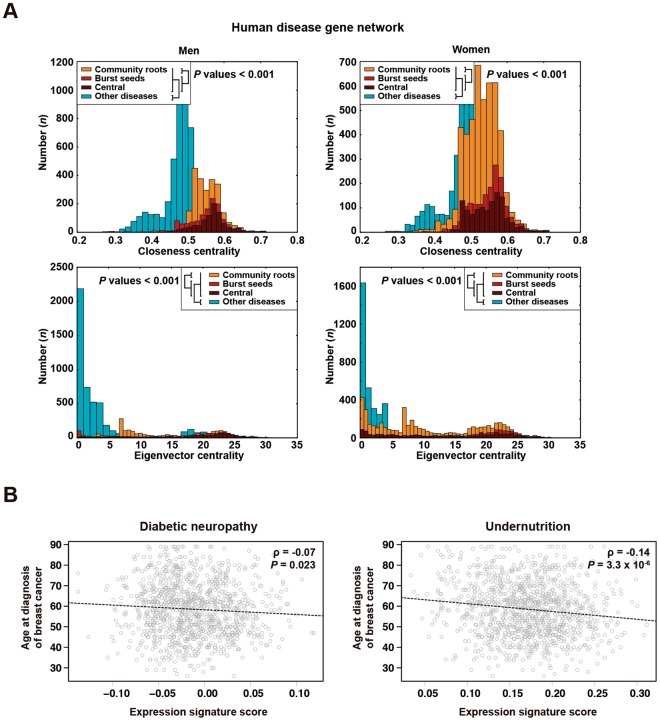
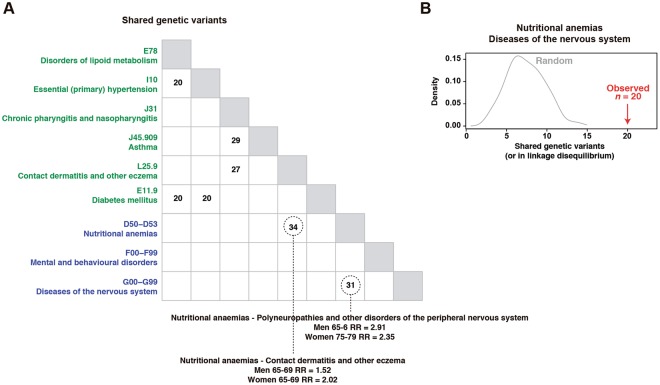
Multimorbidity is an emerging topic in public health policy because of its increasing prevalence and socio-economic impact. However, the age- and gender-dependent trends of disease associations at fine resolution, and the underlying genetic factors, remain incompletely understood. Here, by analyzing disease networks from electronic medical records of primary health care, we identify key conditions and shared genetic factors influencing multimorbidity. Three types of diseases are outlined: "central", which include chronic and non-chronic conditions, have higher cumulative risks of disease associations; "community roots" have lower cumulative risks, but inform on continuing clustered disease associations with age; and "seeds of bursts", which most are chronic, reveal outbreaks of disease associations leading to multimorbidity. The diseases with a major impact on multimorbidity are caused by genes that occupy central positions in the network of human disease genes. Alteration of lipid metabolism connects breast cancer, diabetic neuropathy and nutritional anemia. Evaluation of key disease associations by a genome-wide association study identifies shared genetic factors and further supports causal commonalities between nervous system diseases and nutritional anemias. This study also reveals many shared genetic signals with other diseases. Collectively, our results depict novel population-based multimorbidity patterns, identify key diseases within them, and highlight pleiotropy influencing multimorbidity.


Conflict of interest statement

M.A.P. is recipient of an unrestricted research grant from Roche Pharma for the support of the ProCURE research program of the Catalan Institute of Oncology.

Figures

Figure 1
Figure 1
Study design and disease networks. (A) Strategy for the identification of diseases and genetic factors influencing multimorbidity. Network nodes and edges correspond to diseases and relative risks (RRs), respectively, and were constructed using primary health records from the Catalan general population. The human figures were created by Freepik. (B) Distributions of the number of nodes and edges in each main network component across strata and by gender. (C) Exponential decay of cumulative degree (k) distributions of two example disease networks as depicted. (D) Proportions of linked ICD-10 codes that share a clinical chapter; box-plots show the results of 1,000 permutations and the observed value for each stratum network is indicated by a dot. (E) Number of diseases with causal genes/proteins included in the molecular network that revealed at least one disease association with a smaller shortest path than expected at random. The ordered bars indicate the number of disease associations that match this criterion for each disease (ICD-10 codes are indicated on the x-axis). The gray zone indicates diseases that do not match the criterion. A prevalence threshold is also depicted.
Figure 2
Figure 2
Central diseases and network communities. (A) Diseases emerging as topologically central in men and/or women. The number of appearances (in different strata), the corresponding ages, and the specific condition (chronic or non-chronic) are shown. The dotted lines indicate diseases found to be common to men and women. (B) Disease network for women aged 65–69 years and depicting diseases (ICD-10 codes) identified as central in this gender. The node corresponding to “Diabetes mellitus” (not central) is also indicated (blue font). The node sizes reflect centrality value and their colors indicate communities. Edge thickness is proportional to the magnitude of the RR estimation; black indicates RR > 1.6 and green indicates RR < 0.8. Disease prevalence is shown by font colors as indicated in the inset. (C) Network communities appearing in at least two consecutive strata in men or women. The disease roots of each community are depicted in the insets.
Figure 3
Figure 3
Multimorbidity bursts. (A) Age-based trajectories of nodes with large degree leaps; ≥10 edges (RRs > 1.6) over time. The left and right panels show results for men and women, respectively. The corresponding diseases are listed below each graph, and their chronic or non-chronic status is also shown. (B) Distribution of connectivity leaps in 1,000 random networks with the same degree distribution and connectedness as that of the real morbidity networks with RRs > 1.6. The y- and x-axes depict the probability and number of nodes with leaps of ≥10 edges, respectively; red arrows indicate the values observed in the real networks.
Figure 4
Figure 4
Cumulative risk trends. (A) Average and 95% CI of RR sums by gender and age group. The dotted lines indicate slopes significantly different from zero. (B) Average and 95% CI of RR sums of diseases identified as central in the networks or as other, non-central diseases. The arrows indicate the cumulative risk differences between central and non-central diseases in men (60 years) and women (65 years). (C) Graph showing the correlation between the average centrality value of each node across all networks in men, and the difference between the minimum and maximum RR sums of each disease. The linear trend and 95% CI (shaded area) are shown. (D) Average and 95% CI of RR sums of diseases identified as network community roots or other diseases (i.e., non-roots). The arrow indicates the cumulative risk difference between non-root and root diseases in women (65 years). (E) Average and 95% CI of RR sums of diseases identified as having large degree leaps (≥10 edges, and excluding those that are also central) or other diseases. The arrows indicate cumulative risk differences between disease sets with large leaps and no large leaps in men (55 years) and women (60 years).
Figure 5
Figure 5
Centrality and pleiotropy linked to causal genes. (A) Graphs showing the distributions of closeness and eigenvector centrality measures for different types of causal genes as indicated in the insets. The results correspond to the analysis of the curated human disease gene network and are shown for men and women disease sets derived from the SIDIAP-Q networks study. The Wilcoxon test P values of the comparisons of distributions are shown. (B) Scatter plots depicting the negative correlations between the gene expression signatures (all genes included) that define diabetic neuropathy (left panel) or undernutrition (right panel) and age at diagnosis of breast cancer. The stage-adjusted linear regression coefficients and their corresponding P values are shown.
Figure 6
Figure 6
Shared genetic factors among diseases linked to multimorbidity. (A) Matrix depicting pairs of central (blue) and common (green) diseases, and instances with a significant number of shared genetic variants relative to random GWASs (numbers of variants are shown). The corresponding RRs are shown for instances linking central diseases. (B) Distribution of shared genetic variants (also considering those in linkage disequilibrium) among 100 random sets of 31 variants and observed value of shared signals between “Nutritional anemias” and “Diseases of the nervous system”. The y- and x-axes depict the probability and number of shared variants, respectively; red arrows indicate the value observed.

References

    1. Vetrano DL, et al. An international perspective on chronic multimorbidity: approaching the elephant in the room. J. Gerontol. A. Biol. Sci. Med. Sci. 2018;73:1350–1356. doi: 10.1093/gerona/glx178. - DOI - PMC - PubMed
    1. France EF, et al. Multimorbidity in primary care: a systematic review of prospective cohort studies. Br. J. Gen. Pract. 2012;62:e297–307. doi: 10.3399/bjgp12X636146. - DOI - PMC - PubMed
    1. Buurman BM, Frenkel WJ, Abu-Hanna A, Parlevliet JL, de Rooij SE. Acute and chronic diseases as part of multimorbidity in acutely hospitalized older patients. Eur. J. Intern. Med. 2016;27:68–75. doi: 10.1016/j.ejim.2015.09.021. - DOI - PubMed
    1. Picco L, et al. Economic burden of multimorbidity among older adults: impact on healthcare and societal costs. BMC Health Serv. Res. 2016;16:173. doi: 10.1186/s12913-016-1421-7. - DOI - PMC - PubMed
    1. König H-H, et al. Effects of multiple chronic conditions on health care costs: an analysis based on an advanced tree-based regression model. BMC Health Serv. Res. 2013;13:219. doi: 10.1186/1472-6963-13-219. - DOI - PMC - PubMed

Publication types