. 2018 Oct 29;8(1):15915.
doi: 10.1038/s41598-018-34315-9.

The Beta-adrenergic agonist, Ractopamine, increases skeletal muscle expression of Asparagine Synthetase as part of an integrated stress response gene program

Affiliations

The Beta-adrenergic agonist, Ractopamine, increases skeletal muscle expression of Asparagine Synthetase as part of an integrated stress response gene program

David Brown et al. Sci Rep. .

Erratum in

Abstract

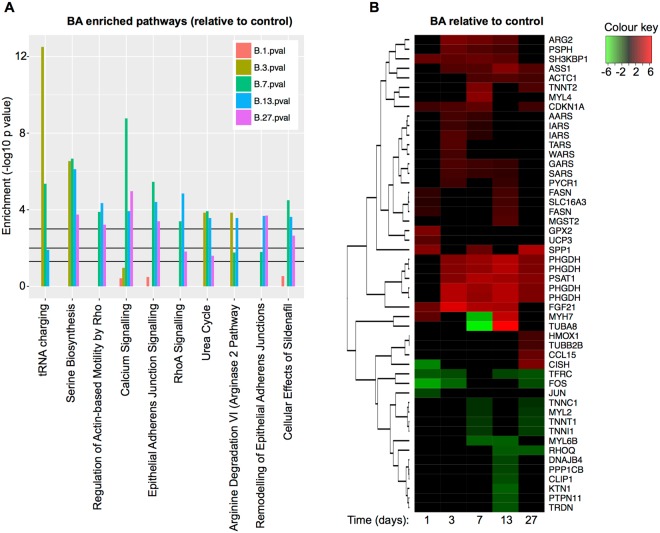
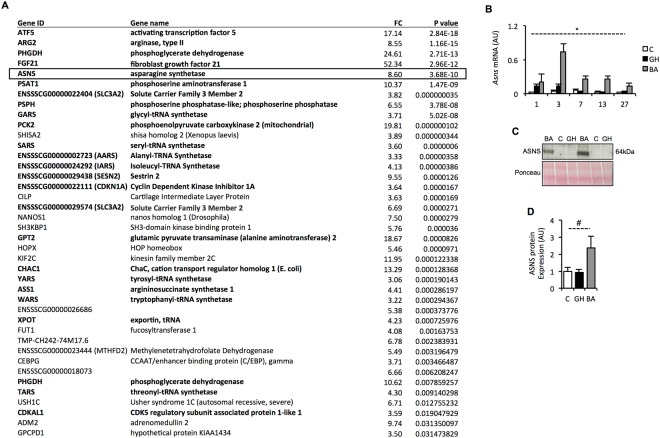
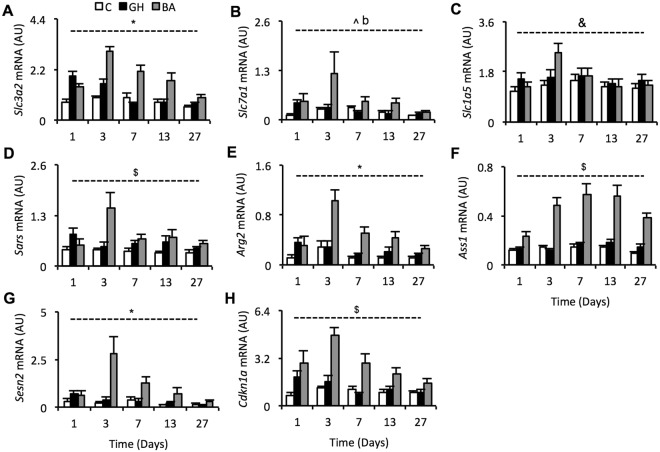
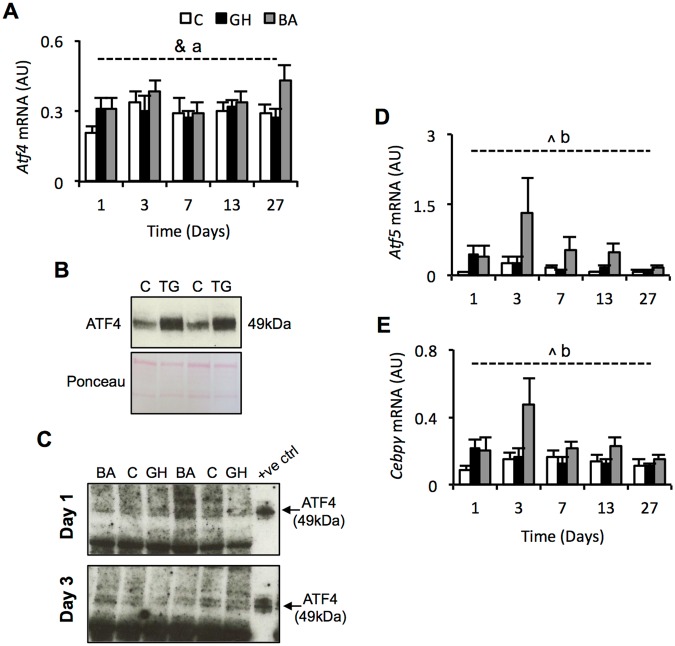
Synthetic beta-adrenergic agonists (BA) have broad biomedical and agricultural application for increasing lean body mass, yet a poor understanding of the biology underpinning these agents is limiting further drug discovery potential. Growing female pigs (77 ± 7 kg) were administered the BA, Ractopamine (20 ppm in feed), or the recombinant growth hormone (GH), Reporcin (10 mg/48 hrs injected) for 1, 3, 7, 13 (n = 10 per treatment, per time point) or 27 days (n = 15 per treatment). Using RNA-sequencing and inferred pathway analysis, we examined temporal changes to the Longissimus Dorsi skeletal muscle transcriptome (n = 3 per treatment, per time point) relative to a feed-only control cohort. Gene expression changes were affirmed by quantitative-PCR on all samples (n = 164). RNA-sequencing analysis revealed that BA treatment had greater effects than GH, and that asparagine synthetase (Asns) was the 5th most significantly increased gene by BA at day 3. ASNS protein expression was dramatically increased by BA treatment at day 7 (p < 0.05). The most significantly increased gene at day 3 was activating transcription factor 5 (Atf5), a transcription factor known to regulate ASNS gene expression. Gene and protein expression of Atf4, another known regulator of Asns expression, was not changed by BA treatment. Expression of more than 20 known Atf4 target genes were increased by BA treatment, suggesting that BA treatment induces an integrated stress response (ISR) in skeletal muscle of pigs. In support of this, mRNA expression of sestrin-2 (Sesn2) and cyclin-dependant kinase 1 alpha (Cdkn1a), two key stress-responsive genes and negative regulators of cellular growth, were also strongly increased from day 3 of BA treatment. Finally, tRNA charging was the most significantly enriched pathway induced by BA treatment, suggesting alterations to the translational capacity/efficiency of the muscle. BA-mediated changes to the skeletal muscle transcriptome are highly indicative of an integrated stress response (ISR), particularly genes relating to amino acid biosynthesis and protein translational capacity.


Conflict of interest statement

The authors declare no competing interests.

Figures

Figure 1
Figure 1
Inferred pathway enrichment analysis for BA treated animals. (A) Enriched pathways are ranked from left-to-right by mean –log10 p value. The 3 black lines from bottom-to-top depict p values of 0.05, 0.01 and 0.001 respectively. Colours of the bar chart are orange (day 1) olive green (day 3), bright green (day 7), blue (day 13) and purple (day 27). (B) Heat map to show top changing genes identified by inferred pathway analysis. Red and green respectively indicate treatment-induced increases and decreases in gene expression relative to that of the control animals. The intensity of red and green denote the significance (−log10 p value) of the change in expression (see colour key). Each column represents a time point (in days) following the initiation of treatment. n = 3 per treatment per time point.
Figure 2
Figure 2
Identification of Asparagine Synthetase (Asns) as a novel BA responsive gene. (A) Genes displaying >3-fold increase in expression with BA treatment at day 3 (relative to control) measured by RNA-sequencing. Genes ranked by significance (p < 0.05). (B) qPCR validation of Asns expression in all samples (Control, BA and GH; total n = 164). *p < 0.001 for time x treatment interaction (see Supplementary Table 2 for post hoc Bonferroni test comparisons). (C) Representative image of western blot for ASNS in control, BA and GH treated LD muscles at day 7 (see supplementary Figure 1 for full blot and gel). (D) Quantitation of ASNS protein abundance at day 7 from western blot. #p < 0.05 (ANOVA).
Figure 3
Figure 3
Validation of amino acid transport, amino acid biosynthesis and tRNA charging gene expression. Messenger RNA expression of the following genes were validated by qPCR on all 164 samples (A) solute carrier family 3 member 2, (B) solute carrier family 7 member 1, (C) solute carrier family 1 member 5, (D) seryl-tRNA synthetase, (E) arginase 2, (F), argininosuccinate synthetase 1, (G) sestrin-2 and (H) cyclin-dependent kinase inhibitor 1A. *Indicates a treatment-time interaction with p < 0.001, $indicates a treatment-time interaction with p < 0.005, ^indicates a treatment effect with p < 0.01, &indicates a treatment effect with p < 0.05, b indicates a significant Dunnetts test with p < 0.01 for BA vs. control (GH vs. control  = NS). For genes with significant interactions, see Supplementary Table 2 for post hoc Bonferroni test comparisons. Data are mean ± SEM. Days 1, 3, 7 and 13 have n = 10 whilst day 27 has n = 15. White bars = control, black bars = GH (growth hormone), grey bars = BA (beta-adrenergic agonist).
Figure 4
Figure 4
Expression of ATF4 is not altered by BA treatment but Atf5 mRNA is increased. (A) mRNA abundance of activating transcription factor 4. (B) Validation of anti-ATF4 antibody to detect ATF4 from protein extracted from cultured porcine muscle cells treated with or without thapsigargin (TG) - see supplementary figure 2 for full blot and gel. (C) Representative western blots attempting to detect ATF4 protein in muscle samples from BA, control or GH treated pigs (see supplementary Figure 3 for full blots). (D) qPCR validation of activating transcription factor 5 gene expression. (E) CCAAT/enhancer binding protein gamma mRNA abundance measured by qPCR. ^indicates a treatment effect with p < 0.01, &indicates a treatment effect with p < 0.05, aindicates a significant Dunnetts test with p < 0.05 for BA vs. control (GH vs. control = NS), bindicates a significant Dunnetts test with p < 0.01 for BA vs. control (GH vs. control = NS). Data is mean ± SEM. Days 1, 3, 7 and 13 have n = 10 whilst day 27 has n = 15. White bars = control, black bars = GH (growth hormone), grey bars = BA (beta-adrenergic agonist).

References

    1. Lynch GS, Ryall JG. Role of beta-adrenoceptor signaling in skeletal muscle: implications for muscle wasting and disease. Physiol. Rev. 2008;88:729–767. - PubMed
    1. Buttery PJ, Dawson JM. Growth promotion in farm animals. Proc. Nutr. Soc. 1990;49:459–66. - PubMed
    1. Parr T, et al. The impact of growth promoters on muscle growth and the potential consequences for meat quality. Meat Sci. 2016 doi: 10.1016/j.meatsci.2016.04.022. - DOI - PubMed
    1. Koopman R, et al. Cellular mechanisms underlying temporal changes in skeletal muscle protein synthesis and breakdown during chronic {beta}-adrenoceptor stimulation in mice. J. Physiol. 2010;588:4811–4823. - PMC - PubMed
    1. Higgins JA, Lasslett YV, Bardsley RG, Buttery PJ. The relation between dietary restriction or clenbuterol (a selective beta 2 agonist) treatment on muscle growth and calpain proteinase (EC 3.4.22.17) and calpastatin activities in lambs. Br J Nutr. 1988;60:645–652. - PubMed

Publication types

MeSH terms