. 2018 Oct 29;9(1):4504.
doi: 10.1038/s41467-018-06526-1.

6mer seed toxicity in tumor suppressive microRNAs

Affiliations

6mer seed toxicity in tumor suppressive microRNAs

Quan Q Gao et al. Nat Commun. .

Abstract

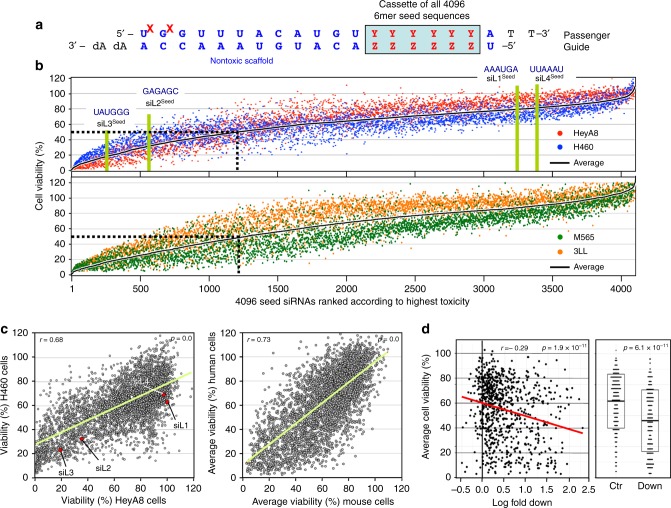
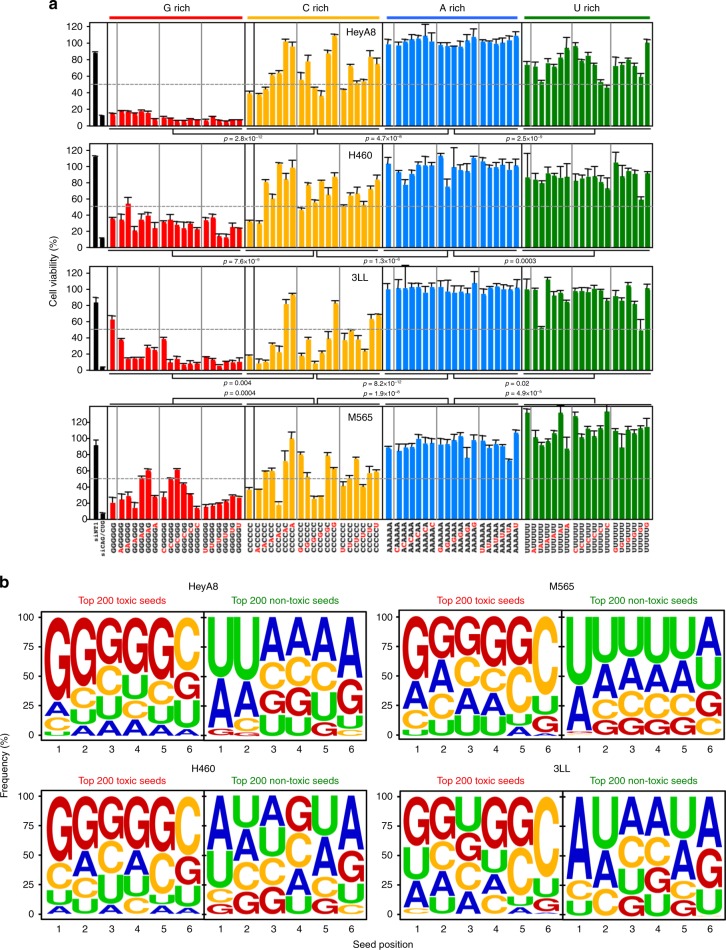
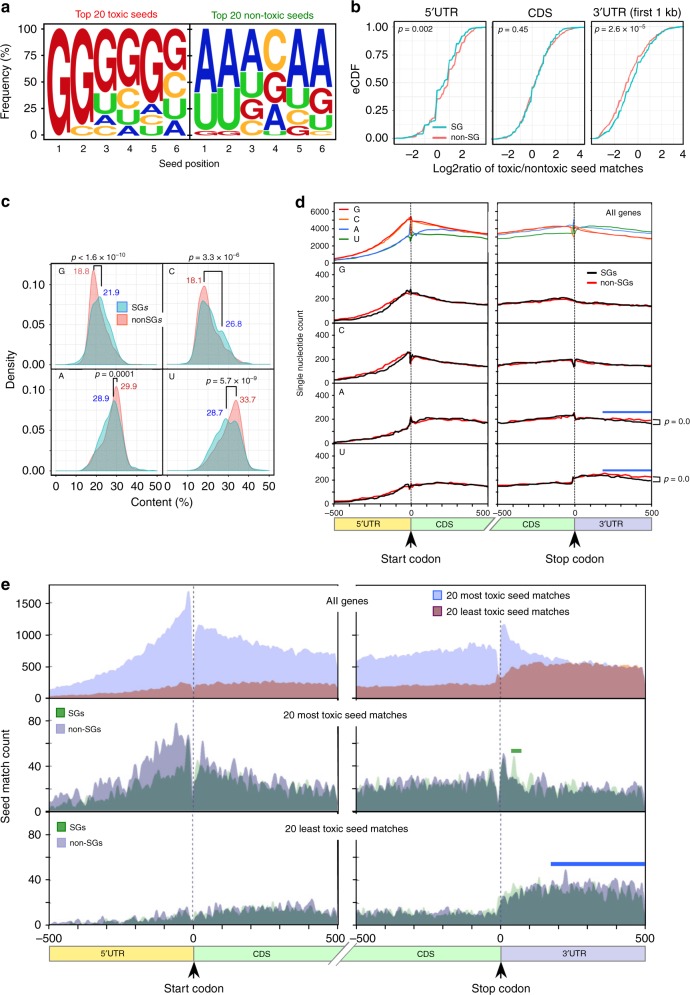
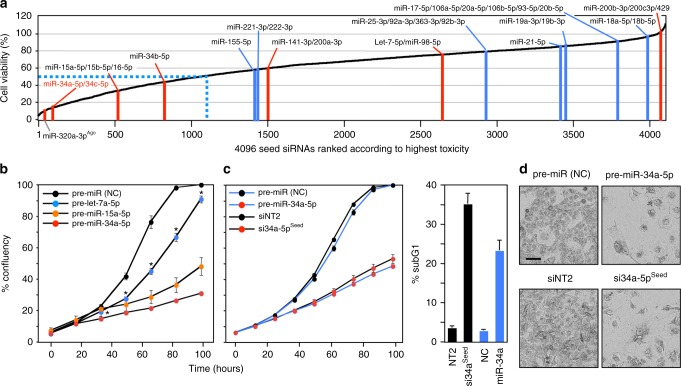
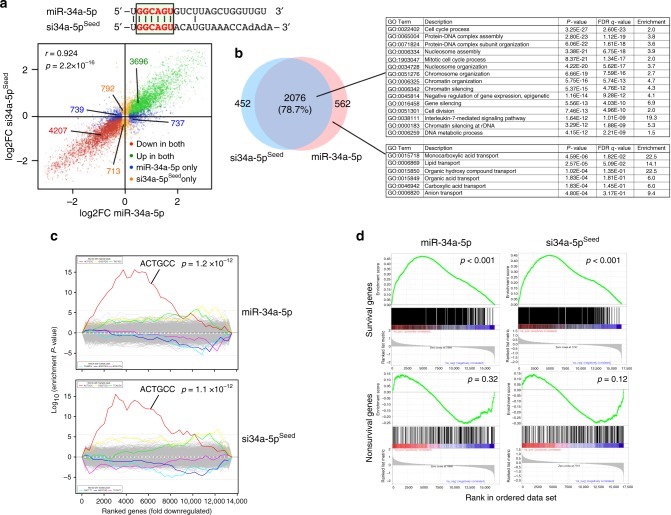
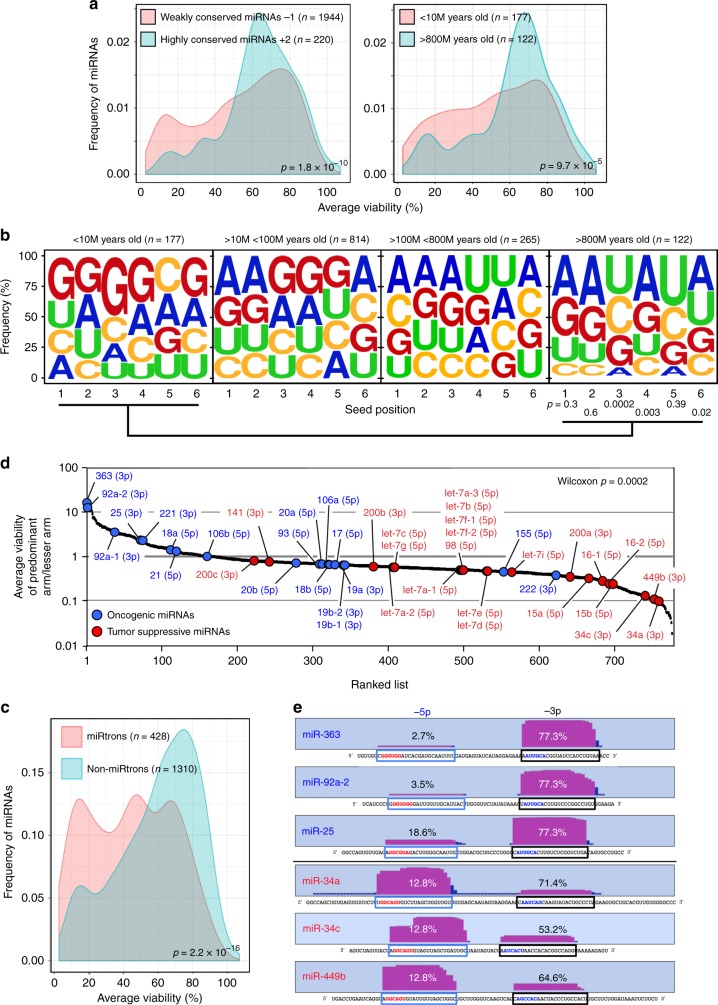
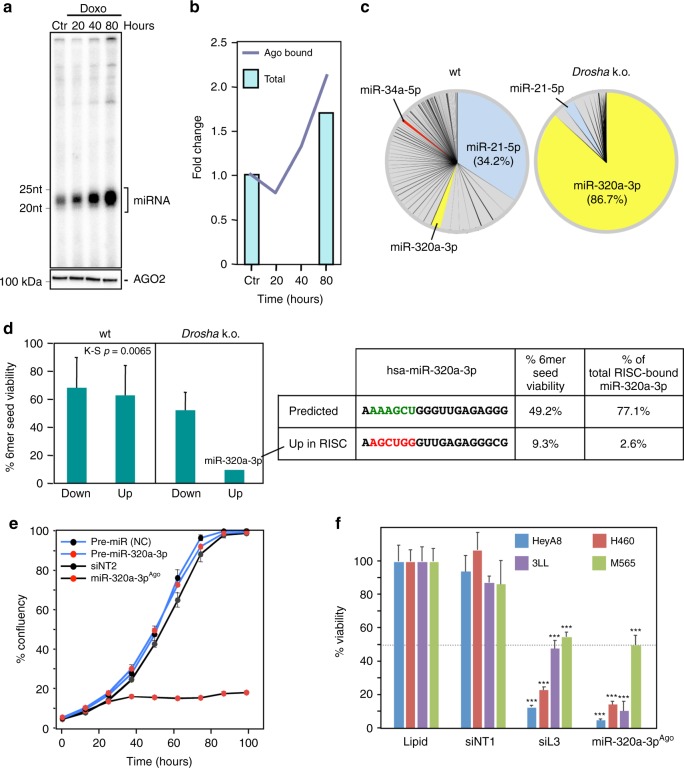
Many small-interfering (si)RNAs are toxic to cancer cells through a 6mer seed sequence (positions 2-7 of the guide strand). Here we performed an siRNA screen with all 4096 6mer seeds revealing a preference for guanine in positions 1 and 2 and a high overall G or C content in the seed of the most toxic siRNAs for four tested human and mouse cell lines. Toxicity of these siRNAs stems from targeting survival genes with C-rich 3'UTRs. The master tumor suppressor miRNA miR-34a-5p is toxic through such a G-rich 6mer seed and is upregulated in cells subjected to genotoxic stress. An analysis of all mature miRNAs suggests that during evolution most miRNAs evolved to avoid guanine at the 5' end of the 6mer seed sequence of the guide strand. In contrast, for certain tumor-suppressive miRNAs the guide strand contains a G-rich toxic 6mer seed, presumably to eliminate cancer cells.


Conflict of interest statement

The authors declare no competing interests.

Figures

Fig. 1
Fig. 1
A comprehensive screen identifies the most toxic 6mer seeds. a Schematic of the siRNA backbone used in the 4096 seed duplexes toxicity screen. Red X: 2′-O-methylation modification; blue letters: constant nucleotides; red letters: variable 6mer seed sequence. b Results of the 4096 6mer seed duplex screen in two human (top) and two mouse (bottom) cell lines. Cells were reverse transfected in triplicates in 384-well plates with 10 nM of individual siRNAs. The cell viability of each 6mer seed duplex was determined by quantifying cellular ATP content 96 h after transfection. All 4096 6mer seeds are ranked by the average effect on cell viability of the four cell lines from the most toxic (left) to the least toxic (right). Rankings of the 6mer seeds of four previously characterized CD95L-derived siRNAs (siL1, siL2, siL3, and siL4) are highlighted in green. We consider an siRNA highly toxic if it reduces cell viability 90% or more and moderately toxic if it reduces cell viability 50% or more (black stippled line). c Regression analysis showing correlation between the 6mer seed toxicity observed in the human lung cancer cell line H460 (y-axis) and the matching 6mer toxicity observed in the human ovarian cancer cell line HeyA8 (x-axis) (left) and average toxicity in the two human cell lines (y-axis) and two mouse cell lines (x-axis) (right). p-Values were calculated using Pearson correlation analysis. d Left: Correlation between the log10 (fold down underrepresentation) of all possible shRNAs that can be derived from the mRNA CDS sequence of CD95L following their expression from a DOX-inducible lentiviral vector and the toxicity of their seed sequences as determined in a 4096 arrayed siRNA screen (average of both human cell lines). Right: Difference in average seed toxicity between the 137 CD95L-derived shRNAs downregulated at least five-fold (=toxic) in this screen compared to a size-matched group of 137 shRNAs that were the least altered in abundance in that screen. Pearson correlation coefficient is given as well as p-value (left) and p-value in analysis on the right was calculated using unpaired two-sided t-test. The center crossbar of the box plot represents the mean, and the upper/lower boundaries demark ±1 standard deviation
Fig. 2
Fig. 2
The most toxic seeds are G rich. a Cell viability of the 19 seed duplexes with the highest content (>80%) in the 6mer seed region for each nucleotide in two human and two mouse cell lines. Samples were analyzed in triplicate and mean ± SD for each sample is shown. p-Values between groups of duplexes were calculated using Student’s t-test. siRNAs are considered to be toxic when viability is inhibited >50% (gray stippled line). b Nucleotide composition at each of the six seed positions in the top 200 most toxic (left) or the top 200 least toxic (right) seed duplexes in the four cell lines.
Fig. 3
Fig. 3
Toxic G-rich seed-containing duplexes target housekeeping genes enriched in Cs. a Nucleotide composition of 20 seeds that are most and least toxic in both human cell lines (see Fig. 1b). b eCDF comparing the ratio of occurrences of the 20 most and least toxic 6mer seed matches in the mRNA elements of two sets of expression-matched survival genes and non-survival genes. Significance was calculated using a two-sample two-sided Kolmogorov–Smirnov (K–S) test. c Probability density plots comparing the nucleotide content between the groups of expression-matched SGs and non-SGs. p-Values were calculated using a two-sample two-sided K–S test comparing the density distribution of SGs and non-SGs. Relevant peak maxima are given. d Single-nucleotide frequency distribution in human mRNAs around the boundaries of the 5′UTR and the beginning of the CDS and the end of the CDS and the beginning of the 3′UTR (shown are 500 bases in each direction). Data are shown for either all human coding genes (top), or a set of 938 SGs or an expression-matched set of 938 non-SGs (bottom four panels). Blue horizontal bars, area of reduced A/U content in SGs. p-Values were calculated using a two-sample two-sided K–S test. e Distribution of the seed matches to the 20 most and least toxic 6mer seeds to human cells in human mRNAs around the boundaries of the 5′UTR and the beginning of the CDS and the end of the CDS and the beginning of the 3′UTR (shown are 500 bases in each direction). Data are shown for either all genes (top) or the expression-matched SGs and non-SGs (center and bottom). Green horizontal bar, area of enriched toxic seed matches in SGs compared to non-SGs. Blue horizontal bar, area of fewer toxic seed matches in SGs
Fig. 4
Fig. 4
Tumor-suppressive miRNAs inhibit cancer cell growth via toxic 6mer seeds. a All 4096 6mer seeds ranked from the lowest average viability (highest toxicity) to the highest viability (lowest toxicity) according to the average of HeyA8 and H460 cells. Locations of 6mer seeds present in major tumor-suppressive (red) or tumor-promoting (blue) miRNAs are highlighted as individual bars. miRNAs are considered to be toxic when viability is inhibited >50% (blue stippled line). b Percent cell confluence over time of HeyA8 cells transfected with 5 nM of either the indicated tumor-suppressive miRNA precursors or an miRNA precursor non-targeting control. Data are representative of two independent experiments. Each data point represents mean ± SE of four replicates. *Two-way ANOVA p-value between cells treated with pre-miR-(NC) and pre-let-7a-5p is 0.0000. c Left: Percent cell confluence over time of HeyA8 parental cells transfected with either pre-miR-34a-5p or si34a-5pSeed and compared to their respective controls (pre-miR (NC) for pre-miR-34a-5p and siNT2 for si34a-5pSeed) at 10 nM. Data are representative of two independent experiments. Each data point represents mean ± SE of four replicates. Right: % cell death of the same cells harvested 4 days after transfection. Data are representative of two experiments. Each data point represents mean ± SD of three replicates. d Morphology of HeyA8 cells transfected with 10 nM of either pre-miR-34a-5p or si34a-5pSeed compared to their respective controls 3 days after transfection
Fig. 5
Fig. 5
miR-34a-5p kills cancer cells through its toxic 6mer seed. a Top: Alignment of the sequences of miR-34a-5p and si34a-5pSeed with the 6mer highlighted. Bottom: Comparison of deregulated mRNAs (adjusted p < 0.05, RPM > 1) in HeyA8 cells 48 h after transfection with either miR-34a-5p or si34a-5pSeed. Pearson correlation p-value is given. b Overlap of RNAs detected by RNA-Seq downregulated in HeyA8 cells (>1.5-fold) 48 h after transfection with either si34a-5pSeed or miR-34a-5p when compared to either siNT2 or a non-targeting pre-miR, respectively. Right: Results of a GOrilla gene ontology analyses of the genes downregulated in both cells transfected with miR-34a-5p or si34a-5pSeed (top, significance of enrichment <10−11), or only in cells transfected with miR-34a-5p (bottom, significance of enrichment <10−4). c Sylamer plots for the list of 3′UTRs of mRNAs in cells treated with either miR-34a-5p (top) or si34a-5pSeed (bottom) sorted from downregulated to upregulated. The most highly enriched sequence is shown which, in each case, is the 6mer seed match of the introduced 6mer seed. Bonferroni-adjusted p-values are shown. d Gene set enrichment analysis for a group of 1846 survival genes (top four panels) and 416 non-survival genes (bottom two panels) after transfecting HeyA8 cells with either miR-34a-5p or si34a-5pSeed. siNT1 and a non-targeting premiR served as controls, respectively. p-values indicate the significance of enrichment
Fig. 6
Fig. 6
Toxic 6mer seeds and the evolution of cancer regulating miRNAs. a Probability density plot of cell viability of the 6mer seeds of either highly conserved (from humans to zebrafish) or poorly conserved miRNA seed families (left panel, total number of mature miRNAs = 2164) or of very old (>800 (M) million years) miRNAs or very young (<10 million years) miRNAs (right panel, total number of miRNAs = 299). For the analysis on the right, miRNA arms with identical sequences (gene duplications) were collapsed and counted as one arm. Two-sample two-sided K–S test was used to calculate p-values. b Change in nucleotide composition in the 6mer seeds of miRNAs of different ages. Significance of change in nucleotide composition at each of the six seed positions between the youngest and oldest miRNAs was calculated using a Fisher’s exact test. Note: the oldest miRNAs also contain tumor-suppressive miRNAs with high G content in positions 1 and 2, which may be the reason the analysis in these two positions did not reach statistical significance. c Probability density plot of cell viability of the 6mer seeds of mature miRtrons or non-miRtrons. miRNAs with identical sequences (gene duplications) were collapsed and counted as one seed. Two-sample two-sided K–S test was used to calculate p-value. d Seven hundred and eighty miRNAs (Supplementary Data 4) ranked according to the ratio of viability of the seed (as determined in the seed screen) of the guide strand and the lesser-expressed arm. Established oncogenic miRNAs are shown in blue; tumor-suppressive miRNAs are shown in red. The guide strand is given for each miRNA (in parenthesis). p-Value of the distribution of oncogenic versus tumor-suppressive miRNAs was calculated using Wilcoxon rank test. e Cumulative read numbers from the 5p or the 3p arm (according to miRBase.org) of three oncogenic and three tumor-suppressive miRNAs with the highest (top three) or a very low ratio of the viability of the guide strand versus the lesser arm. The viability numbers of the matching 6mer seeds according to the siRNA 6mer seed screen are given. The sequences of the mature 5p or 3p arms are boxed in blue and black, respectively. Toxic seeds are shown in red, and non-toxic ones in blue
Fig. 7
Fig. 7
Genotoxic drugs cause upregulation of tumor-suppressive miRNAs with toxic 6mer seeds. a Top: Autoradiograph of radiolabeled RNAs pulled down with the Ago proteins from HeyA8 cells treated with doxorubicin (Doxo) for different times. Bottom: Western blot for the pulled down AGO2 of the same samples shown above. The images are representative of two biological duplicates. b Fold change of the total reads of Ago-bound small RNAs after 20, 40, or 80 h of Doxo treatment compared to the control sample from Ago-IP sequencing data (Ago-bound). Fold change of the total reads of cytosolic small RNAs in HeyA8 cells treated with Doxo for 80 h compared to the control sample from small RNA-Seq data is given (Total). Data are the combination of biological duplicates. c Pie charts showing the composition of miRNAs bound to Ago proteins after 50 h Doxo treatment in HCT116 wild type (left) or Drosha k.o. cells (right). d Left, 6mer seed viability (average between HeyA8 and H460 cells, two replicates) of the Ago-bound miRNAs most up- and downregulated in wt or Drosha k.o. cells after Doxo treatment. K–S test was used to calculate p-value. Right, Comparison of the predicted (and most abundant) sequence of miR-320a-3p and Ago-bound sequence of miR-320a-3p and their average viability found most upregulated in Drosha k.o. cells after Doxo treatment. Shown is variance of two biological replicates. e Percent cell confluence over time of HeyA8 cells transfected with 5 nM of controls, pre-miR-320a-3p, or an siRNA duplex that corresponds to the shifted form of miR-320a-3p (si-miR-320a-3pAgo) that was found to be upregulated and bound to Ago proteins upon Doxo treatment. Data are representative of two independent experiments. Each data point represents mean ± SE of four replicates. f Viability changes (ATP content) in four cell lines 96 h after transfection with Lipid only, 10 nM of siNT1, siL3, a non-targeting pre-miR, or miR-320a-3pAgo—the only shared upregulated miRNA in HeyA8 cells, HCT116 wild-type, and HCT116 Drosha k.o. cells—after Doxo treatment. p-Values were determined using Student’s t-test. ***p < 0.0001. Samples were performed in triplicate (siNT1, siL3), six repeats (miR-320a-3pAgo) and eight repeats (lipid)

References

    1. Lee Y, et al. MicroRNA genes are transcribed by RNA polymerase II. EMBO J. 2004;23:4051–4060. doi: 10.1038/sj.emboj.7600385. - DOI - PMC - PubMed
    1. Han J, et al. The Drosha-DGCR8 complex in primary microRNA processing. Genes Dev. 2004;18:3016–3027. doi: 10.1101/gad.1262504. - DOI - PMC - PubMed
    1. Yi R, Qin Y, Macara IG, Cullen BR. Exportin-5 mediates the nuclear export of pre-microRNAs and short hairpin RNAs. Genes Dev. 2003;17:3011–3016. doi: 10.1101/gad.1158803. - DOI - PMC - PubMed
    1. Bernstein E, Caudy AA, Hammond SM, Hannon GJ. Role for a bidentate ribonuclease in the initiation step of RNA interference. Nature. 2001;409:363–366. doi: 10.1038/35053110. - DOI - PubMed
    1. Hutvagner G, et al. A cellular function for the RNA-interference enzyme Dicer in the maturation of the let-7 small temporal RNA. Science. 2001;293:834–838. doi: 10.1126/science.1062961. - DOI - PubMed

Publication types