. 2018 Dec;19(12):1341-1351.
doi: 10.1038/s41590-018-0237-5. Epub 2018 Oct 29.

Myeloid-derived suppressor cells control B cell accumulation in the central nervous system during autoimmunity

Affiliations

Myeloid-derived suppressor cells control B cell accumulation in the central nervous system during autoimmunity

Benjamin Knier et al. Nat Immunol. 2018 Dec.

Abstract

Polymorphonuclear myeloid-derived suppressor cells (PMN-MDSCs) have been characterized in the context of malignancies. Here we show that PMN-MDSCs can restrain B cell accumulation during central nervous system (CNS) autoimmunity. Ly6G+ cells were recruited to the CNS during experimental autoimmune encephalomyelitis (EAE), interacted with B cells that produced the cytokines GM-CSF and interleukin-6 (IL-6), and acquired properties of PMN-MDSCs in the CNS in a manner dependent on the signal transducer STAT3. Depletion of Ly6G+ cells or dysfunction of Ly6G+ cells through conditional ablation of STAT3 led to the selective accumulation of GM-CSF-producing B cells in the CNS compartment, which in turn promoted an activated microglial phenotype and lack of recovery from EAE. The frequency of CD138+ B cells in the cerebrospinal fluid (CSF) of human subjects with multiple sclerosis was negatively correlated with the frequency of PMN-MDSCs in the CSF. Thus PMN-MDSCs might selectively control the accumulation and cytokine secretion of B cells in the inflamed CNS.


Conflict of interest statement

Competing financial interests: The authors declare no competing financial interests.

Figures

Figure 1
Figure 1. LOX1+ PMN-MDSCs in the CSF are negatively correlated with intrathecal CD138+ B cells in patients with MS and indicate stable disease.
a, Correlation of CD19+CD138+HLA-DR+ B cells with LOX1+ PMN-MDSCs, CD4+ T helper cells, CD8+ cytotoxic T cells, CD3-CD19-CD56+ natural killer (NK) cells, and CD3-CD19-CD14+ monocytes in the CSF of therapy naïve patients with relapsing remitting MS or clinically isolated syndrome (CIS) (n=25); symbols depict individual patients; not significant (ns); Spearman's r analysis. b, Flow-cytometry analysis and May-Gruenwald-Giemsa staining of granulocytic CD15+CD11bintCD33highLOX1high, CD15+CD11bhighCD33lowLOX1low and monocytic CD15-CD14+HLA-DRlow (M-MDSCs) cells from the blood mononuclear cell (PBMC) compartment of MS patients; grey histograms depict isotype controls; representative of five independent experiments; scale bar 5 μm; gate on live single cells. c, 3H-thymidine incorporation of CD40 antibody- and IL-4-stimulated CD19+CD27- B cells upon co-culture in descending ratios with CD15+CD11bintCD33highLOX1high PMN-MDSCs from PBMCs and CD15+CD11bhighCD33low LOX1low neutrophils from whole blood samples; symbols depict counts per minute (cpm, mean + s.d.) of three replicate wells; representative plots of two independent experiments; Kruskal-Wallis test with Dunn's post test; *p<0.05. d, Frequencies of M-MDSCs and LOX1+ PMN-MDSCs in PBMCs of healthy control individuals (HC, n=31) and MS/CIS patients (n=70); symbols depict individual patients (bars mean + s.d.); Mann-Whitney U test, corrected for age. e, Frequencies of M-MDSCs and LOX1+ PMN-MDSCs in PBMCs of CIS/MS patients during acute relapse (relapse, n=35, 51.4% female, age 31 ± 9 years, disease duration 22 ± 44 months) or in stable patients (no relapse, n=35, 65.7% female, age 42 ± 12 years, disease duration 68 ± 97 months); symbols depict individual patients (bars mean + s.d.), Mann-Whitney U test, corrected for age. f, Frequencies of LOX1+ PMN-MDSCs in PBMCs of therapy naïve patients during acute relapse (naïve relapse, n=32) or with stable disease (naïve no relapse, n=25) and of patients under immunosuppressive therapy that suffered from acute relapse (therapy, relapse n=3) or were stable (therapy, no relapse n=10); symbols depict individual patients (bars mean ± SD); Kruskal-Wallis test with Dunn's post test, corrected for age; *p<0.05, **p<0.01.
Figure 2
Figure 2. Population dynamics and phenotype of Ly6G+ neutrophils within different compartments in the course of EAE.
a, CSF total cell and Ly6G-tdTomato+ cell counts during different EAE phases in Ly6gCre/WT mice; naïve n=6, onset n=11, peak n=8, recovery n=12; symbols depict individual mice (bars mean + s.d.); data were pooled from four independent experiments; Kruskal-Wallis test with Dunn's post test; *p<0.05, **p<0.01, ***p<0.001. b, Population dynamics of CD4+Foxp3- effector T cells, CD4+Foxp3+ regulatory T cells, CD19+ B cells, Ly6G-tdTomato+ cells, CD45highCD11b+ monocytes and CD45intCD11b+ microglia purified from brain, spinal cord, optic nerve, CSF, and blood during EAE onset, peak, and recovery in Ly6gCre/WT mice (n=4 per time point); bars depict mean values of different cell subsets from pooled Ly6gCre/WT mice. c, Analysis of CXCL1 levels in the CSF of Ly6gCre/WT mice during different EAE phases; naïve=3, onset n=5, peak n=7, recovery n=7; symbols depict individual mice (bars mean + s.d.), Kruskal-Wallis test with Dunn's post test; *p<0.05. d, May-Gruenwald-Giemsa staining of Ly6G-tdTomato+ cells from naïve spleen, spleen during EAE onset, CNS during EAE onset, and CNS during EAE recovery; representative of six individual mice; scale bar 5 μm. e, Flow-cytometry analysis of intracellular NOS2 in Ly6G-tdTomato+ cells from spinal cords of EAE mice at onset, peak, and recovery; representative of 6 mice per time point; gate on CD11b+Ly6G+ cells. f, Arginase 1 (Arg1) enzyme activity assay with Ly6G-tdTomato+ cells ex vivo from brain and spinal cord of Ly6gCre/WT mice at EAE onset, peak, and recovery; symbols depict individual mice (bars mean + s.d.); Kruskal-Wallis test with Dunn's post test; *p<0.05, **p<0.01.
Figure 3
Figure 3. In the EAE model, the generation of PMN-MDSCs is restricted to the inflamed CNS.
a-c, RNA-seq analysis of Ly6G-tdTomato+ cells from the spleen and the CNS of Ly6gCre/WT mice at different stages of EAE (onset d13, early recovery d22). a, 3D principal component analysis of gene expression in Ly6G-tdTomato+ cells; symbols represent individual mice, colored by condition. b, Gene set enrichment analysis (GSEA) of a human PMN-MDSC-signature in murine Ly6G-tdTomato+ populations according to their rank in PC1 and PC3. c, Analysis of universally downregulated or upregulated genes in CNS onset-Ly6G+ cells vs all other Ly6G+ populations. Plot of the top 6 overrepresented gene ontology terms (focus on 'function' in GOrilla), sorted by -log10 (p-value). d-f, Adoptive transfer of Ly6G-tdTomato+ cells from the spleen of immunized Ly6gCre/WT donor mice (CD45.2+) (d7) and transferred into congenic (CD45.1+) hosts that had been immunized for EAE 14 days earlier. d, e, Flow-cytometry analysis (d) and frequencies (e) of transferred Ly6G+ cells donor cells (CD45.2+) re-isolated from spleens and CNS of recipient mice (CD45.1+) on days 1 (d15 after immunization), 4 (d18), and 7 (d 21) after transfer; symbols depict individual mice (bars mean + s.d., n=3 per time point); gate on live single Ly6G+ cells. f, Intracellular staining for Ki67 (proliferation) and NOS2 in transferred Ly6G+ cells re-isolated from spleen and CNS on day 4 after transfer; spleen and CNS plots were generated from 3 pooled mice; numbers in the histograms indicate difference in mean fluorescence intensity as compared to FMO (ΔMFI); gate on Ly6G+CD45.2+CD45.1- (donor) cells.
Figure 4
Figure 4. PMN-MDSCs contribute to inducing recovery from EAE.
a, EAE disease course in Ly6gCre/WT mice treated with 400 µg of Ly6G antibody (Ly6G Ab, n=10) or rat IgG2a control antibody (Control, n=8) i.p. every other day (highlighted by arrows), starting on d12 after EAE induction; symbols depict means and s.d.; two-way ANOVA with Bonferroni’s multiple comparison; ***p<0.001; representative disease course of three independent experiments. b, EAE disease course in Ly6gCre/WT mice treated with 200 µg/kg G-CSF (G-CSF, n=5) or control 5% glucose (Control, n=5) i.p. every other day (highlighted by arrows), starting on d12 after immunization; symbols depict means and s.d.; two-way ANOVA with Bonferroni’s multiple comparison; *p<0.05. c, Flow-cytometry analysis of CD19+ B cells and CD4+ T cells within the CD11b- lymphoid compartment purified at early disease recovery (d22) from spinal cords of Ly6gCre/WT mice treated with control IgG or Ly6G antibody; representative plots of 5 mice from each group; gate on live CD45.2+CD11b- cells. d, Flow-cytometry analysis of CD19+ B cells and CD4+ T cells within the CD11b- lymphoid compartment purified at early disease recovery (d21) from spinal cords of Ly6gCre/WT mice control-treated or treated with G-CSF; representative plots of 5 mice from each group; gate on live CD45.2+CD11b- cells. e, Total number of CD19+ B cells purified at early disease recovery (d22) from spinal cords of Ly6gCre/WT mice treated with control antibody (Control, n=5) or Ly6G antibody (Ly6G Ab, n=5); symbols depict individual mice (bars mean + s.d.); Mann-Whitney U test; **p<0.01. f, Total number of CD19+ B cells purified at early disease recovery (d21) from spinal cords of Ly6gCre/WT mice control-treated or treated with G-CSF; symbols depict individual mice (bars mean ± SD); Mann-Whitney U test; **p<0.01. g, Correlation of CD19+ B cell and Ly6G+ MDSC frequencies in the spinal cord of G-CSF-treated and control-treated Ly6gCre/WT mice at early disease recovery (d21); symbols depict individual mice; Spearman's r; **p<0.01. h, 3H-thymidine incorporation of CD40 antibody- and IL-4-stimulated CD19+B220+ B cells from spleens of naïve Ly6gCre/WT mice upon co-culture in descending ratios with Ly6G+ cells from the CNS and spleen of Ly6gCre/WT EAE mice at disease onset (d12) and early recovery (d20); symbols depict counts per minute (cpm, mean + s.d.) of three replicate wells; Kruskal-Wallis test with Dunn's post test; *p<0.05.
Figure 5
Figure 5. Ly6G+ cells differentiate into MDSCs in the CNS in a STAT3-dependent manner.
a, qRT-PCR analysis of Il6st mRNA (which encodes gp130) in Ly6G+ cells purified from naïve bone marrow (BM Naive, n=3), naïve spleen (Spleen Naive, n=4), and from spleen (Spleen EAE, n=4) and CNS (CNS EAE, n=4) of EAE mice (d17 after immunization); results are normalized relative to Ly6G+ cells purified from naïve spleen; symbols depict individual mice (bars mean +s.d.); one-way-ANOVA with Tukey's post test; ****p<0.0001. b, Gene set enrichment analysis, testing a set of STAT3-targeted genes on subsets of Ly6G+ cells. c, EAE disease course in Ly6gCre/WT (n=10) and Stat3ΔLy6G (n=14) mice; symbols depict means and s.d.; two-way ANOVA with Bonferroni’s multiple comparison test; **p<0.01; representative disease course out of three independent experiments. d, Flow-cytometry analysis of CD19+ B cells and CD4+ T cells within the live CD45.2+CD11b- lymphoid compartment in the spinal cord of Ly6gCre/WT and Stat3ΔLy6G mice at early recovery (d24); representative plots of 8 mice in each group. e, Analysis of CXCL1 and CXCL13 protein levels in the CSF of Ly6gCre/WT (n=5) and Stat3ΔLy6G (n=6) mice at early disease recovery (d24); symbols depict individual mice (bars mean + s.d.); Unpaired Student's t-test; *p<0.05. f, 3H-thymidine incorporation of CD40 antibody- and IL-4-stimulated CD19+B220+ B cells from spleens of naïve Ly6gCre/WT mice upon co-culture with-Ly6G+ cells from the CNS of Ly6gCre/WT or Stat3ΔLy6G EAE mice at early recovery (d21) in the presence of L-NMMA, L-NOHA, CD274 antibody (CD274 Ab), VISTA antibody (VISTA Ab) or without any supplement; symbols depict counts per minute (cpm, mean + s.d.) of three replicate wells; Kruskal-Wallis test with Dunn's post test; *p<0.05. g, Flow-cytometry analysis of intracellular Ki67 in CD3+ T cells and CD19+ B cells among CNS CD11b- cells of Ly6gCre/WT or Stat3ΔLy6G mice at early disease recovery (d21); representative plots of 6 mice in each group. h, i, Accumulation of B cells in the meninges and CNS parenchyma of Stat3ΔLy6G mice. Immunohistochemical analysis of B220+ B cells from Ly6gCre/WT control (h) and Stat3ΔLy6G EAE mice (i) at early recovery (d23); 20 x magnification, scale bar 100 µm; representative of 5 mice in each group.
Figure 6
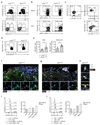
Figure 6. Ly6G+ cells interact with B cells in the CNS.
a, Flow-cytometry analysis of CNS CD19+B220+ B cells from Ly6gCre/WT control and Stat3ΔLy6G mice at early disease recovery (d21), showing the expression of IgM and CD23 (upper plots) and the expression of CD43 and CD93 on IgM+CD23- gated B cells (lower plots); representative plots of 6 mice in each group. b, Flow-cytometry analysis of spleen (upper plots) and CNS (lower plots) CD19+B220+ B cells from Ly6gCre/WT control and Stat3ΔLy6G mice at early disease recovery (d21), showing the expression of MHC-II and CD138; representative plots of 6 mice in each group. c, Flow-cytometry analysis of intracellular IL-6 and GM-CSF in CNS CD19+B220+ B cells of Ly6gCre/WT mice at at early disease recovery (d22) and stimulated ex vivo with PMA/ionomycin in the presence of brefeldin A, gated on CD23- (left upper plot) and CD23+ (lower plot); representative plots of 7 mice. d, Flow-cytometry analysis of intracellular GM-CSF in ex vivo stimulated CD19+B220+ B cells from the brains of Ly6gCre/WT control and Stat3ΔLy6G mice at early disease recovery (d23); representative plots of 4 (Ly6gCre/WT) and 5 (Stat3ΔLy6G) mice in each group; gate on CD45+CD11b- cells. e, Frequencies of GM-CSF producers within the CD19+B220+ B cell compartment from the brain and spinal cord of Ly6gCre/WT (n=4) and Stat3ΔLy6G (n=5) mice at disease recovery (d23); symbols depict individual mice (bars mean + s.d.); Mann Whitney U test; *p<0.05. f-h, Immunofluorescence analysis using markers for neutrophils (Ly6G), B cells (B220) and phosphorylated STAT3 (pSTAT3) in spinal cord sections of Ly6gCre/WT mice (f) and Stat3ΔLy6G mice (g) at early disease recovery (d23); scale bars 20 μm; higher power magnification of individual channels and merge in the lower rows of (f) and (g); scale bars 10 μm. h, Examples of Ly6G+ cells in close proximity of B220+ B cells in the spinal cord of Stat3ΔLy6G mice during early recovery (d23); scale bar 10 μm. i, j, Flow-cytometry analysis of intracellular pSTAT3 in splenic Ly6G+ cells. i, Exposure to IL-6 or IL-6-IL-6Rα in the presence of IL-6Rα antibody (IL-6R Ab) or control IgG; gate on CD11b+Ly6G+ cells; relative (rel.) MFI is normalized to the MFI of pSTAT3 in Ly6G+ cells exposed to IL-6 in the presence of IL-6Rα antibody. j, Ly6G+ cells were either added to the bottom compartment (together with a T and B cell co-culture) or to the top compartment (physically separated from the T and B cell co-culture) of a transwell system in the presence of IL-6Rα antibody or control IgG; gate on CD11b+Ly6G+CD4-CD19- cells; relative MFI is normalized to the MFI of pSTAT3 in Ly6G+ cells from the top compartment in the presence of anti-IL-6Rα; representative plots of two experiments.
Figure 7
Figure 7. B cells determine disease progression in the absence of functional MDSCs.
a, b, Total numbers of CD19+B220+ B cells (a) and frequencies of GM-CSF-producing CD19+B220+ B cells (b) within the CD45+ compartment in the brain and spinal cord of Ly6gCre/WT and Stat3ΔLy6G mice at disease recovery (d25) when the mice were either control treated (IgG1κ) or i.v. injected with 10 µg/g CD20 antibody (CD20 Ab) every 5 days starting on day 12 after immunization; symbols depict individual mice (bars mean ± SD); Kruskal-Wallis-test with Dunn's post test; *p<0.05, **p<0.01. c, EAE disease course in Ly6gCre/WT control mice treated with IgG1κ control antibody (n=4) or CD20 antibody (CD20 Ab, n=4); symbols depict means and s.d.; two-way ANOVA with Bonferroni’s multiple comparison; **p<0.01. d, EAE disease course in Stat3ΔLy6G mice treated with IgG1κ control antibody (n=5) or CD20 antibody (CD20 Ab, n=4); symbols depict means and s.d.; two-way ANOVA with Bonferroni’s multiple comparison; *p<0.05.

References

    1. Lappat EJ, Cawein M. A Study of the Leukemoid Response to Transplantable A-280 Tumor in Mice. Cancer Res. 1964;24:302–311. - PubMed
    1. Bronte V, et al. Recommendations for myeloid-derived suppressor cell nomenclature and characterization standards. Nature communications. 2016;7 12150. - PMC - PubMed
    1. Condamine T, et al. Lectin-type oxidized LDL receptor-1 distinguishes population of human polymorphonuclear myeloid-derived suppressor cells in cancer patients. Science immunology. 2016;1 - PMC - PubMed
    1. Dufait I, et al. Signal transducer and activator of transcription 3 in myeloid-derived suppressor cells: an opportunity for cancer therapy. Oncotarget. 2016;7:42698–42715. - PMC - PubMed
    1. Lelis FJN, et al. Myeloid-derived suppressor cells modulate B-cell responses. Immunol Lett. 2017;188:108–115. - PubMed

Publication types