. 2018 Nov;13(11):1078-1086.
doi: 10.1038/s41565-018-0274-0. Epub 2018 Oct 29.

Physical activation of innate immunity by spiky particles

Affiliations

Physical activation of innate immunity by spiky particles

Ji Wang et al. Nat Nanotechnol. 2018 Nov.

Abstract

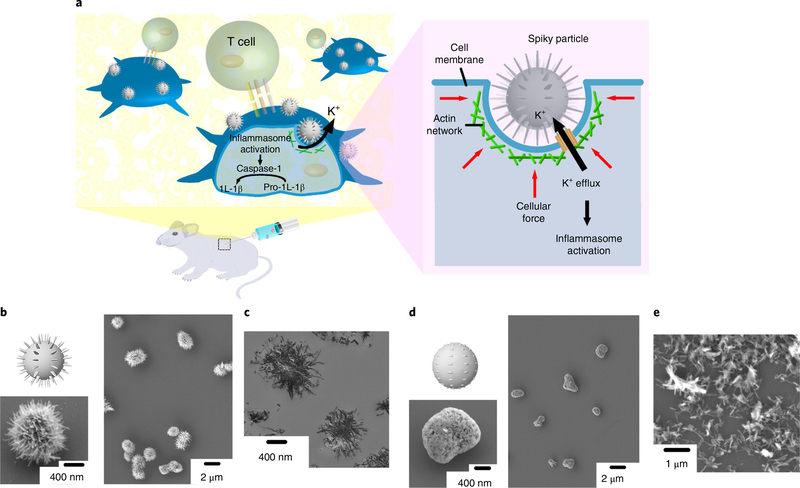
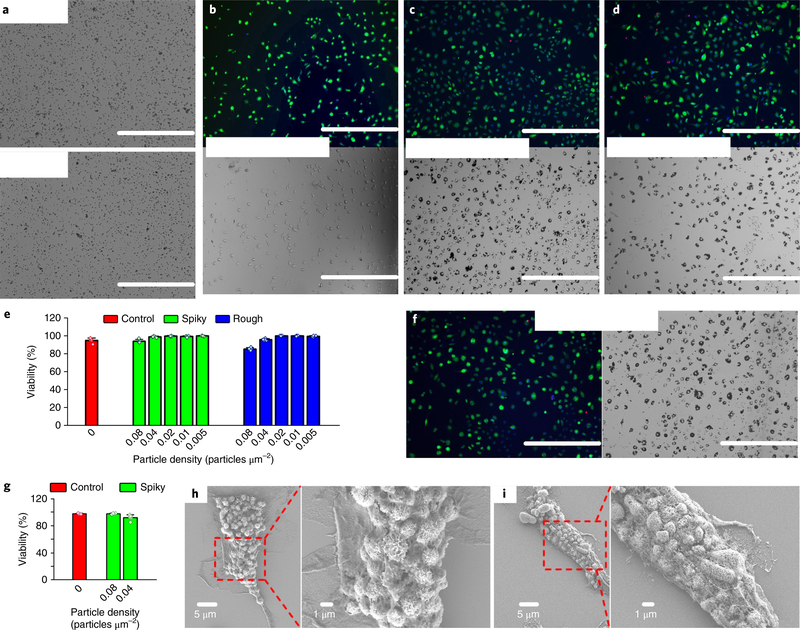
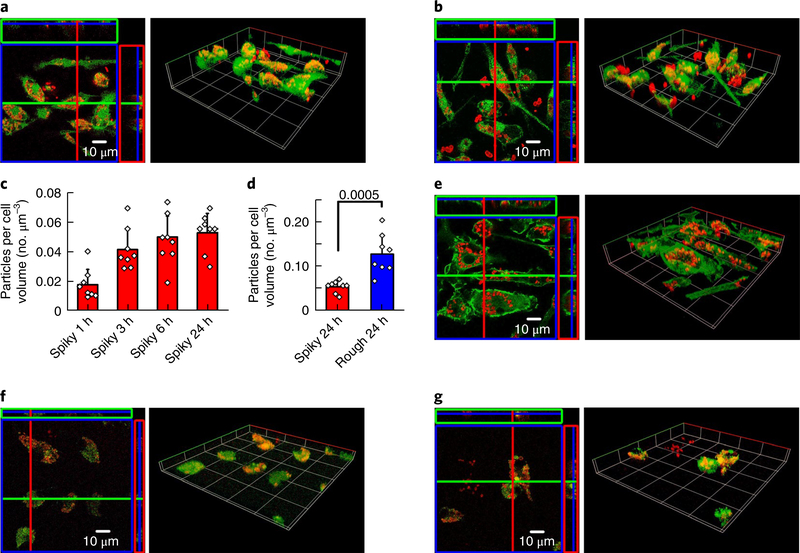
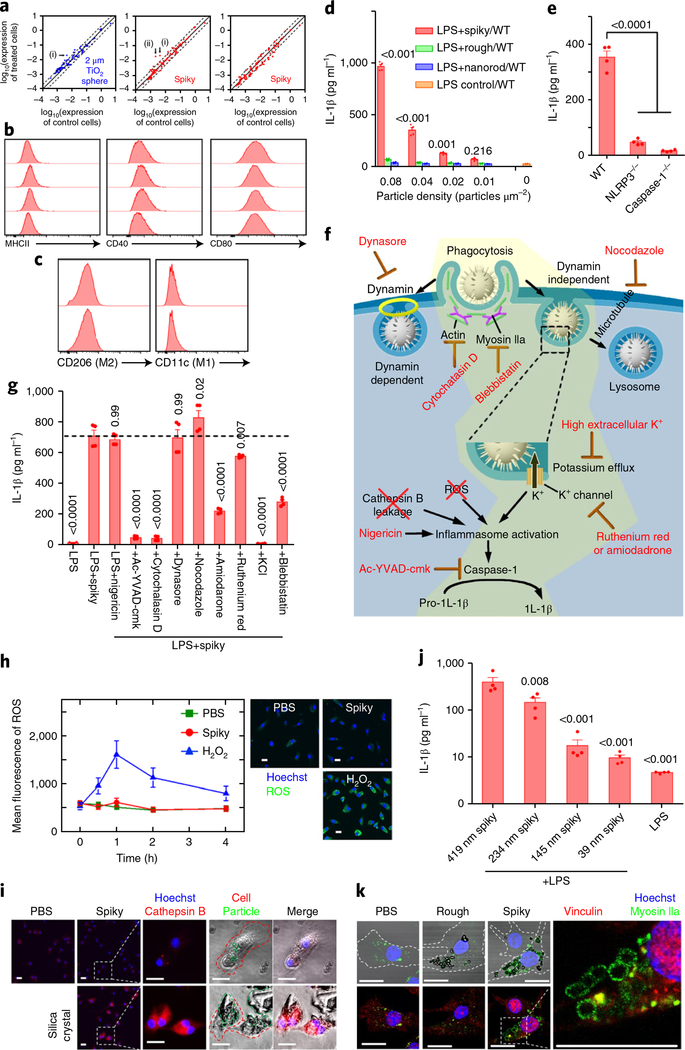
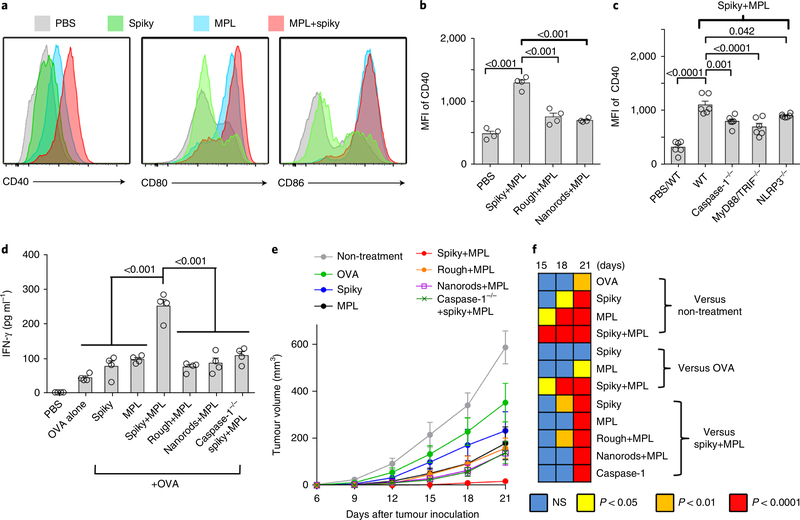
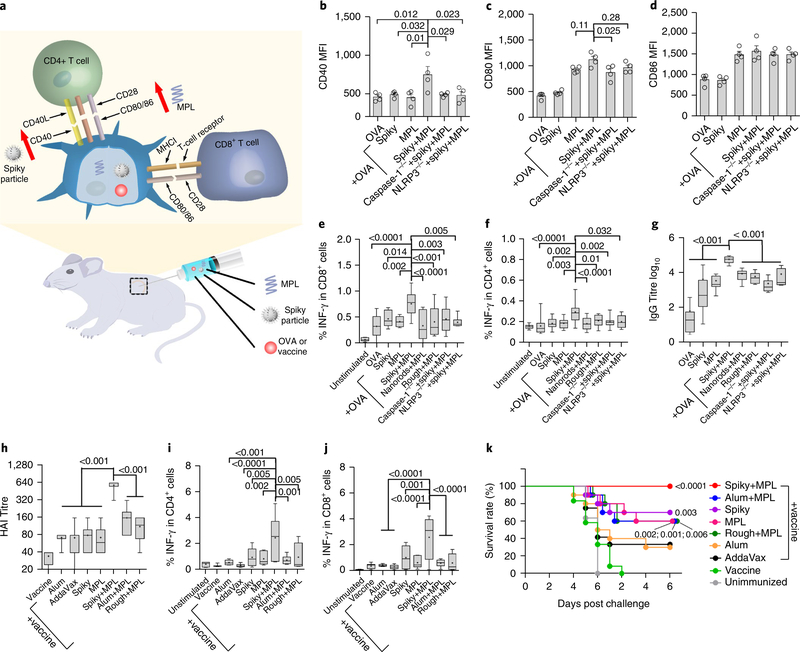
Microbial biochemicals have been indicated as the primary stimulators of innate immunity, the first line of the body's defence against infections. However, the influence of topological features on a microbe's surface on immune responses remains largely unknown. Here we demonstrate the ability of TiO2 microparticles decorated with nanospikes (spiky particles) to activate and amplify the immune response in vitro and in vivo. The nanospikes exert mechanical stress on the cells, which results in potassium efflux and inflammasome activation in macrophages and dendritic cells during phagocytosis. The spiky particles augment antigen-specific humoral and cellular immune responses in the presence of monophosphoryl lipid A and elicit protective immunity against tumour growth and influenza viral infection. The study offers insights into how surface physical cues can tune the activation of innate immunity and provides a basis for engineering particles with increased immunogenicity and adjuvanticity.


Conflict of interest statement

Competing interests

The authors declare no competing interests.

Figures

Fig. 1 |
Fig. 1 |. Schematic and particle fabrication.
a, Schematic of spiky particles applied to activate immune cells and amplify immune responses in vivo. b,c, SEM (b) and TEM (c) images of spiky particles. d,e, SEM images of rough particles (d) and the sonicated-off nanospikes (nanorods) (e).
Fig. 2 |
Fig. 2 |. BMM viability and cell–particle interface study.
a, Optical images of spiky (top) and rough (bottom) particles at a typical dose of 0.04 particles μm−2. Scale bars, 200 μm. b-d, Fluorescence (top) and optical (bottom) images of BMMs after incubation without particles (b), or with spiky particles (c) or rough particles (d) at 0.04 particles μm−2 for 48h. The assay stained live cells with calcein (green), dead cells with ethidium bromide (red) and cell nuclei with Hoechst (blue). Scale bars, 400 μm. e, Macrophage viability after incubation with the indicated particles at different doses for 48h. n = 5 biologically independent samples. f, Fluorescent (left) and optical (right) images of BMMs after incubation with spiky particles at 0.04 particles μm−2 for 96 h. Scale bars, 400 μm. g, Macrophage viability after incubation with spiky particles at the indicated doses for 96h. n = 5 biologically independent samples. h,i, SEM images that show BMMs interfaced with spiky particles (h) and rough particles (i). The particles were observed to be engulfed or fully internalized. All the experiments were repeated twice with similar results. Statistical data presented as the mean± s.d.
Fig. 3 |
Fig. 3 |. BMM-particle interface study via confocal fluorescence microscopy.
a,b, BMMs interfaced with spiky particles (a) or rough particles (b) for 24h with cytosol staining: green, cell cytosol; red, particles. The confocal fluorescence images were reconstructed with both the orthographic view (left) and the 3D view (right). c,d, Quantitative analysis of spiky particle uptake at different time points (1, 3, 6 and 24h) (c), and comparison of particle uptake after 24 h of incubation (d). n = 8 independent cells. The significance was calculated by a two-tailed f-test. e, The interface between the BMM actin networks and spiky particles after 24 h of incubation. Green, cell actin network; red, particles. f,g, Spiky particles (f) or rough particles (g) entrapped in cell endosomes after 24h of particle incubation. Green, cell endosomes; red, particles. All the experiments were repeated twice with similar results. Statistical data presented as the mean±s.d.
Fig. 4 |
Fig. 4 |. Spiky particles activate inflammasomes.
Particle concentrations were 0.04 particles μm−2 in all the studies except for d. a, Expression levels of 89 genes, which include cytokines, chemokines, cytokine/chemokine receptors and activation markers, were analysed by quantitative real-time RT-PCR after BMMs were cultured with control particles (2 μm TiO2 microspheres) (left) or spiky particles (centre and right) for 12 (left and centre) or 48 h (right). Solid lines indicate no significant changes between the control and treated cells, whereas the dashed lines indicate twofold up- or downregulation. The genes CD28 (i) and CXCL2 (ii) were altered by spiky particle treatments, but CD28 was also slightly upregulated by the control particle treatment. b, Cell activation markers CD40, CD80 and MHCII were analysed by flow cytometry after the BMMs were incubated with spiky (second row) or rough (third row) particles or nanorods (bottom row) for 12 h (the top row is the control). c, Cell differentiation into CD11c+ (M1 marker) or CD206+ (M2 marker) was analysed in BMMs incubated with spiky particles for 12 h (bottom; top is the control). d, The release of IL-1β owing to inflammasome activation was analysed by ELISA. n = 4 biologically independent samples. BMMs from the WT were primed with LPS for 3 h followed by incubation of the cells with the indicated doses of spiky particles, rough particles or nanorods for another 18 h. e, Spiky particle-induced inflammasome activations of BMMs from WT, caspase-1−/− or NLRP3−/− mice were analysed by ELISA. n = 4 biologically independent samples. f, Illustration of possible inflammasome activation mechanisms. The yellow region indicates a feasible mechanism supported by the experiments. g, Elucidation of the mechanism of the underlying inflammasome activation evoked by spiky particles. BMMs were pretreated with the indicated inhibitors for 0.5 h and treated with LPS and spiky particles. The dotted line indicates the mean of the LPS+spiky group. n = 4 biologically independent samples. h, ROS levels after incubation with spiky particles, or with H2O2 as the positive control. ROS levels at different time points are shown (left) and representative images were obtained 1 h after particle incubation (right). Green fluorescence indicates ROS production (blue is Hoechst). Scale bars, 20 μm. n = 10 images. i, The release of cathepsin B (red fluorescence) indicated a frustrated phagocytosis and lysosome disruption. BMMs were incubated for 3 h with spiky particles, or with silica crystals as the positive control. The red dashed lines indicate a cell border, and the green dashed lines indicate particles or silica crystals. Scale bars, 20 μm. j, The particles with different spike lengths (419 ± 83, 234 ±56,145 ± 42 and 39 ± 17nm) were cultured with BMMs in the presence of LPS as in d. IL-1β levels were measured by ELISA. n = 4 biologically independent samples. k, Recruitment of myosin IIa is shown by green fluorescence around the phagocytized particles. BMMs were cultured with rough or spiky particles for 5 h, after which vinculin was labelled with red fluorescence. The dashed line indicates a cell border. Scale bars, 20 μm. Data are presented as the mean± s.e.m. All the experiments were repeated three times with similar results. The significance was calculated by one-way ANOVA compared to the LPS control in d, to the WT mice in e, to LPS+spiky in g or to 419nm spiky+LPS in j.
Fig. 5 |
Fig. 5 |. Spiky particles enhance DC maturation and DC-meditated cancer immunotherapy.
a, Upregulation of the activation markers CD40, CD80 and CD86 on DCs. BMDCs were incubated with spiky particles, MPL or a combination of both for 12h. b, BMDCs were incubated with MPL plus spiky particles, rough particles or nanorods for 12 h, and the expression of the CD40 marker was analysed by flow cytometry. n = 4 biologically independent samples. MFI, mean fluorescence intensity. Representative flow cytometric profiles are given in Supplementary Fig. 14a. c, BMDCs from WT, caspase-1−/−, MyD88/ TRIF−/− and NLRP3−/− mice were cultured with spiky+MPL, and the expression of the CD40 marker was analysed by flow cytometry as in Supplementary Fig. 14b. n = 6 biologically independent samples. The particle dose was 0.04 particles μm−2 in b and c. d, In vitro CD8 T-cell activation assay. BMDCs from WT or caspase-1−/− mice were stimulated with antigen alone (OVA plus SIINFEKL peptide) or coupled with spiky particles, MPL alone or combinations. Activated DCs were subsequently incubated with T cells from OT-I mice for 3 d. The IFN-γ secreted from the T cells was measured by ELISA. n = 4 biologically independent samples. e, DC-mediated cancer immunotherapy. Mice were subcutaneously injected with 5×10⁵ EG7 tumour cells and BMDCs, as in d, were administered 3 and 7d later. The tumour volumes were monitored every 3d. n = 8 tumours. f, The significance between the indicated groups on days 15–21 was calculated by two-way ANOVA and is shown as a heat map. All the experiments were repeated twice with similar results. The significance between the indicated groups in b-d was calculated by one-way ANOVA. Data are presented as the mean± s.e.m. NS, not significant.
Fig. 6 |
Fig. 6 |. Spiky particles coupled with MPL as a potent adjuvant.
a, Schematic of a working model for the combination of spiky particles and MPL. b-d, WT, NLRP3−/− or caspase 1−/− mice received subcutaneous injections of OVA with or without spiky particles, MPL or spiky+MPL. The draining lymph nodes were collected 36 h later, and the expressions of CD40 (b), CD80 (c) and CD86 (d) markers on the gate of the DCs were analysed by flow cytometry (gating strategy is given in Supplementary Fig. 15). MFI is presented as the mean ± s.e.m. n = 4 mice. e,f, Cellular immune responses including IFN-γ-secreting CD8+ (e) and CD4+ (f) T cells were measured 7d after immunization. CD4+ and CD8+ T cells that expressed the indicated cytokine were analysed in the gate of CD3+ T cells, as detailed in Supplementary Fig. 16a. From left to right, n = 6, 14, 8, 8, 20, 12, 12, 12 and 6 mice. g, Serum IgG antibody titres were determined 14d after immunization. From left to right, n = 8, 8, 8, 6, 6, 6, 6 and 5 mice. h-k, Influenza vaccination and challenges. h, Mice were immunized on day 0 and day 14 with 2009 H1N1 monovalent influenza vaccine with the indicated adjuvants, including AddaVax (50μl per mouse), alum (1 mg per mouse), spiky (1 mg per mouse), MPL (10 μg per mouse) or spiky+MPL (1 mg / 10 μg per mouse). Sera were collected 7 d after the final immunization and measured for HAI titre. n = 6 mice, except for the vaccine and AddaVax for which n = 8. i,j, Cellular immune responses were also measured 5 d after the final immunization (gating strategy is given in Supplementary Fig. 16b). n = 6 mice, except for vaccine and AddaVax for which n = 8. k, The immunized mice were challenged with 20xLD50 A/California/7/2009 H1N1 influenza virus 14d after the final immunization. Survival rates were monitored for an additional 12d. n = 10 mice, except for vaccine and AddaVax for which n = 12. Survival curves are compared with vaccine group by the Gehan-Breslow-Wilcoxon test. All the experiments were repeated twice with similar results. The significance between the indicated groups in b-j was calculated by one-way ANOVA. Immune response data are presented as box and whiskers, and the mean is shown by a + sign. Body weight data are presented as the mean±s.e.m.

Comment in

  • A spike in inflammation.
    Johnson BM, Junkins RD, Ting JP. Johnson BM, et al. Nat Nanotechnol. 2018 Nov;13(11):980-981. doi: 10.1038/s41565-018-0292-y. Nat Nanotechnol. 2018. PMID: 30374158 No abstract available.
  • Immune response by touch.
    Minton K. Minton K. Nat Rev Immunol. 2018 Dec;18(12):730-731. doi: 10.1038/s41577-018-0090-7. Nat Rev Immunol. 2018. PMID: 30420704 No abstract available.

References

    1. Iwasaki A & Medzhitov R Control of adaptive immunity by the innate immune system. Nat. Immunol. 16, 343–353 (2015). - PMC - PubMed
    1. Brubaker SW, Bonham KS, Zanoni I & Kagan JC Innate immune pattern recognition: a cell biological perspective. Annu. Rev. Immunol. 33, 257–290 (2015). - PMC - PubMed
    1. Medzhitov R Toll-like receptors and innate immunity. Nat. Rev. Immunol. 1, 135–145 (2001). - PubMed
    1. Petrovsky N & Aguilar JC Vaccine adjuvants: current state and future trends. Immunol. Cell Biol. 82, 488–496 (2004). - PubMed
    1. Reed SG, Orr MT & Fox CB Key roles of adjuvants in modern vaccines. Nat. Med. 19, 1597–1608 (2013). - PubMed

Publication types

MeSH terms