. 2018 Dec;3(12):1441-1450.
doi: 10.1038/s41564-018-0267-7. Epub 2018 Oct 29.

Microbial nitrogen limitation in the mammalian large intestine

Affiliations

Microbial nitrogen limitation in the mammalian large intestine

Aspen T Reese et al. Nat Microbiol. 2018 Dec.

Abstract

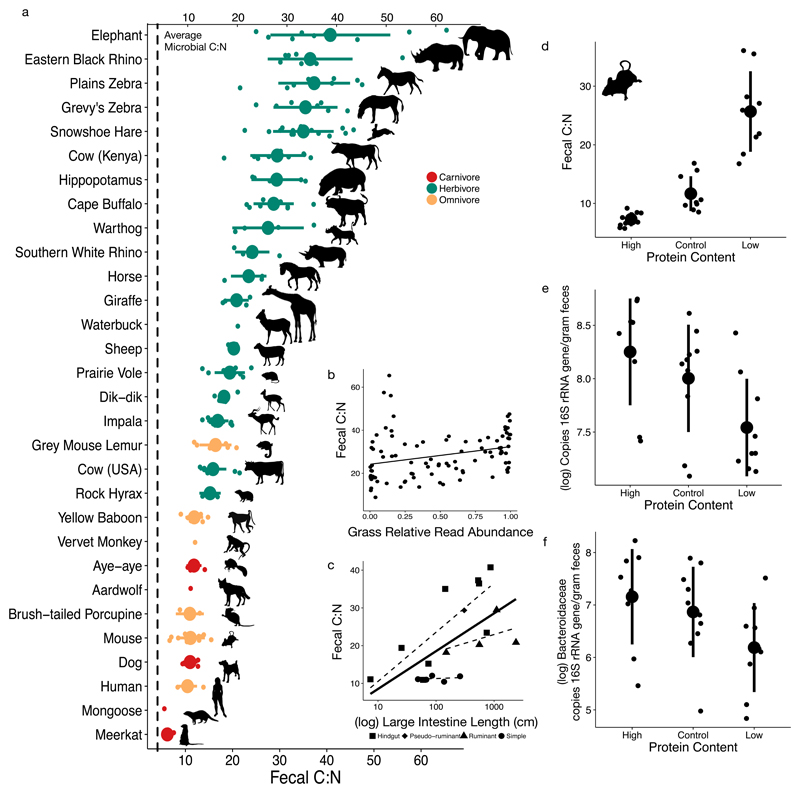
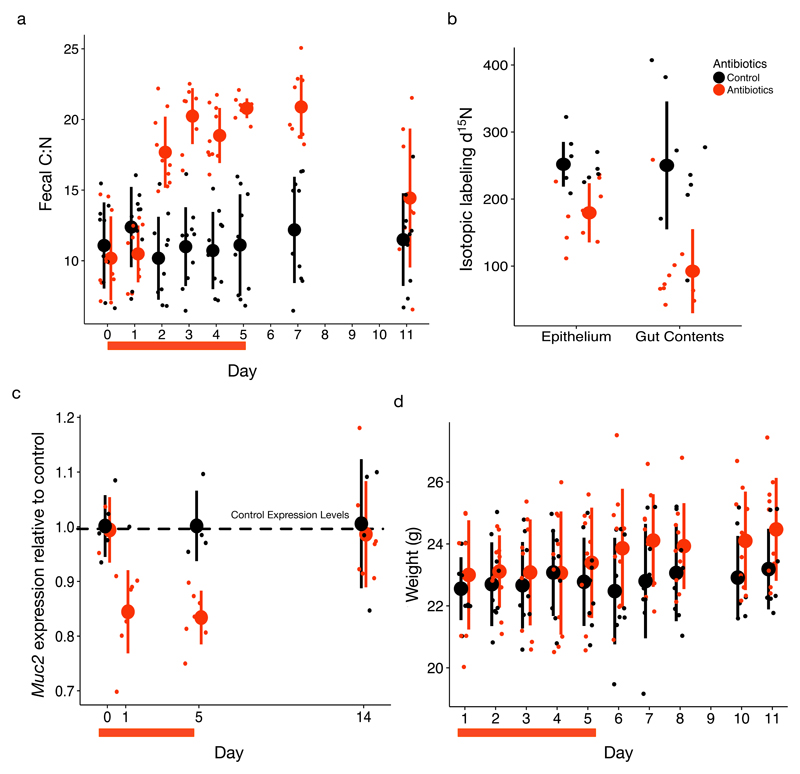
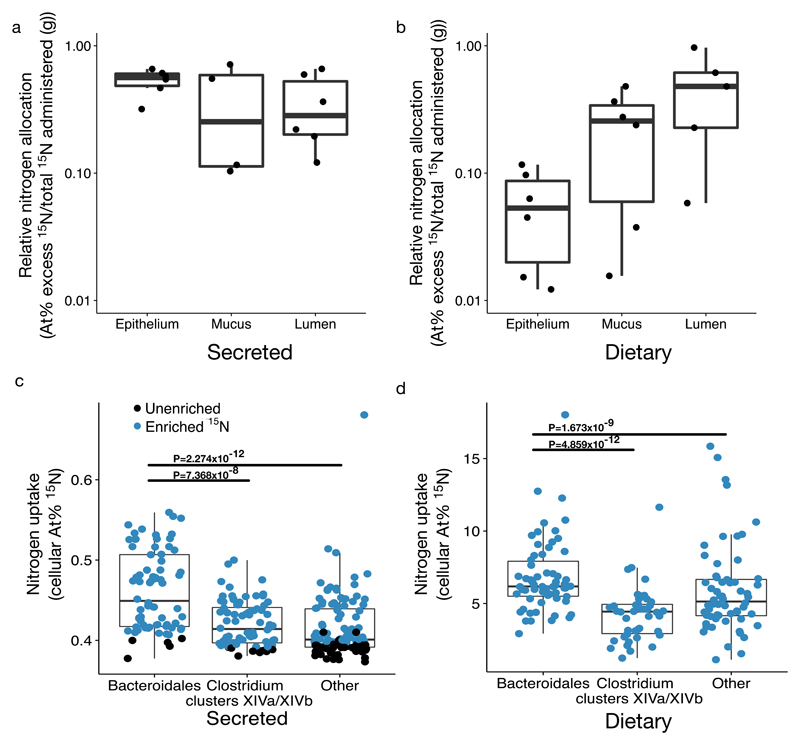
Resource limitation is a fundamental factor governing the composition and function of ecological communities. However, the role of resource supply in structuring the intestinal microbiome has not been established and represents a challenge for mammals that rely on microbial symbionts for digestion: too little supply might starve the microbiome while too much might starve the host. We present evidence that microbiota occupy a habitat that is limited in total nitrogen supply within the large intestines of 30 mammal species. Lowering dietary protein levels in mice reduced their faecal concentrations of bacteria. A gradient of stoichiometry along the length of the gut was consistent with the hypothesis that intestinal nitrogen limitation results from host absorption of dietary nutrients. Nitrogen availability is also likely to be shaped by host-microbe interactions: levels of host-secreted nitrogen were altered in germ-free mice and when bacterial loads were reduced via experimental antibiotic treatment. Single-cell spectrometry revealed that members of the phylum Bacteroidetes consumed nitrogen in the large intestine more readily than other commensal taxa did. Our findings support a model where nitrogen limitation arises from preferential host use of dietary nutrients. We speculate that this resource limitation could enable hosts to regulate microbial communities in the large intestine. Commensal microbiota may have adapted to nitrogen-limited settings, suggesting one reason why excess dietary protein has been associated with degraded gut-microbial ecosystems.


Conflict of interest statement

Conflict of interest: The authors declare no conflict of interest.

Figures

Fig. 1
Fig. 1. Fecal C:N varied between mammals, was linked to diet and physiology, and controls microbial abundance in vivo.
a-c, Fecal C:N varied between mammals based on taxonomy, diet, and physiology. Fecal C:N from 30 mammal species (n=1-15 individuals per species, mean=7, see Supplementary Information Table 2) is higher than the average bacterial C:N (4.07, vertical dashed line) from gut isolates grown in vitro (n=35 strains, see Supplementary Information Table 1; a). Fecal C:N from East African herbivores and omnivores (n=16 species, see Methods for list) was positively correlated (linear regression fit shown) with proportional representation of grasses in the diet based on DNA metabarcoding (ρ=0.42, P<0.0001, Spearman correlation; n=95 fecal samples; b). Mammalian fecal C:N was also associated with the large intestine length (log transformed; P=0.04, ANCOVA) and gut architecture (P=0.03, ANCOVA; n=4-9 species per physiological group except pseudoruminant which has n=1; c). The solid line shows linear regression fit for large intestine length overall, while dashed lines show linear regression fits for each gut architecture group. d-f, Altering dietary protein (Supplementary Table 5) for two weeks impacted murine gut nitrogen and microbiota. Murine fecal C:N differed under altered-protein diets (P=5.87x10⁻⁶, Kruskal-Wallis test; n=9-10 mice per diet group; d). Microbial load, estimated by 16S rRNA gene copy number via qPCR, also changed under altered protein diets (P=0.017, Kruskal-Wallis test; n=9-10 mice per diet group; e). Bacteroidaceae abundance, calculated as 16S rRNA gene copy number multiplied by their relative abundance, changed under altered protein diets (P=0.05, Kruskal-Wallis test; n=9-10 mice per diet group; f). Large circles are means; bars show standard deviations.
Fig. 2
Fig. 2. Antibiotics change gut nitrogen and host secretions.
a, Antibiotic cocktail (ampicillin, vancomycin, metronidazole, and neomycin) treatment induced a significant increase in fecal C:N (P=2.647x10⁻¹¹, linear mixed effects model likelihood test; n=9-10 mice per treatment group)), followed by re-convergence within 6 day post-treatment. b-c, This increase is concomitant with decreases in nitrogen secretion as measured by (b) isotopic label delivery to epithelial tissue and gut contents (P=0.001, Mann-Whitney U tests; n=10 mice per treatment group) and (c) mucin production (measured as Muc2 expression) relative to control levels (dotted line) during treatment (P=1.0, 0.016, 0.016, 0.58 Wilcoxon signed rank tests for treated mice relative to control average on days 0, 1, 5, and 14, respectively; n=6 treated mice). d, Mouse weight increased more over the 11 day experiment in antibiotic-treated mice than in control mice (P=0.0002, linear mixed effects model likelihood test). Red bars under the x-axis indicate the 5 day course of antibiotics. Large circles are means; bars show standard deviations.
Fig. 3
Fig. 3. Microbes use nitrogen from host diet and secretions.
(a-b) Nitrogen in the gut is sourced both from host diet and host secretions. 15N isotope enrichment (adjusted for total 15N administered) was significantly different from zero for both (a) injected threonine secretions and (b) dietary nitrogen in large intestine epithelium, mucosa, and lumen layers (null hypothesis: μ=0; P=0.03, one-sample Wilcoxon tests; n=6 mice per treatment). (c-d) For large intestine gut microbiota from mice treated with labeled nitrogen, single cell isotopic enrichment was quantified on a NanoSIMS following FISH to distinguish between microbial taxonomic groups (n=2 mice per treatment group). Bacteroidales were disproportionate nitrogen consumers relative to other bacterial taxa: cells targeted by the Bacteroidales probe (Bac303) were more highly enriched for 15N from host secreted labeled threonine (n=72-110 cells per target; c) and also from host diet (n=42-62 cells per target; d) than the Clostridium cluster XIVa and XIVb-specific (Erec482) or other DAPI stained cells (P<0.05, Bonferroni-corrected Mann-Whitney U tests). Bars indicate groups which differed significantly from Bacteroidales. Isotope enrichment is reported as atom percent (i.e., the proportional representation of the heavy isotope times 100; c-d) or as atom percent excess (i.e., the difference between atom percent of the treated sample and the average control; a-b; see Methods). Blue points refer to cells significantly enriched in 15N. Boxplots summarize all cells (enriched and unenriched) and show median and quartiles; whiskers show the 1.5*interquartile range.

References

    1. McFall-Ngai M. Adaptive immunity: care for the community. Nature. 2007;1145:153. - PubMed
    1. Sender R, Fuchs S, Milo R. Are we really vastly outnumbered? revisiting the ratio of bacterial to host cells in humans. Cell. 2016;164:337–340. - PubMed
    1. Lennon JT, Jones SE. Microbial seed banks: the ecological and evolutionary implications of dormancy. Nature Reviews Microbiology. 2011;9:119–130. - PubMed
    1. Hooper LV, Macpherson AJ. Immune adaptations that maintain homeostasis with the intestinal microbiota. Nature Reviews Immunology. 2010;10:159–169. doi: 10.1038/nri2710. - DOI - PubMed
    1. Backhed F, Ley RE, Sonnenburg JL, Peterson DA, Gordon JI. Host-bacterial mutualism in the human intestine. Science. 2005;307:1915–1920. - PubMed

Publication types