

Deep sequencing and miRNA profiles in alcohol-induced neuroinflammation and the TLR4 response in mice cerebral cortex
- PMID: 30374194
- PMCID: PMC6206094
- DOI: 10.1038/s41598-018-34277-y
Deep sequencing and miRNA profiles in alcohol-induced neuroinflammation and the TLR4 response in mice cerebral cortex
Abstract
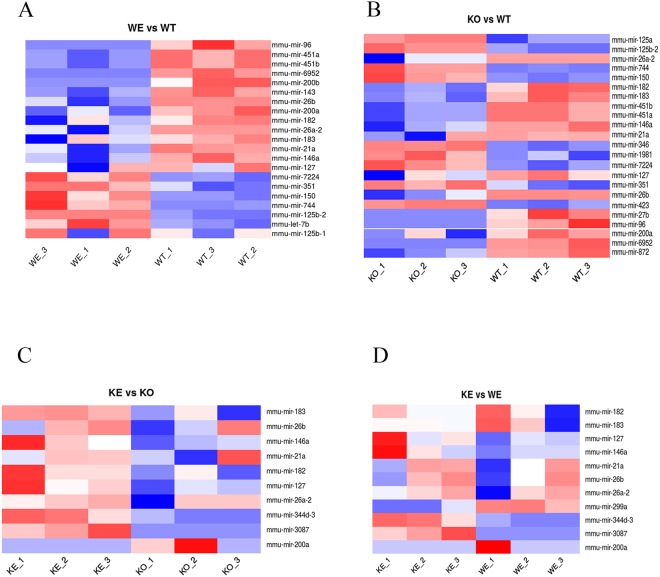
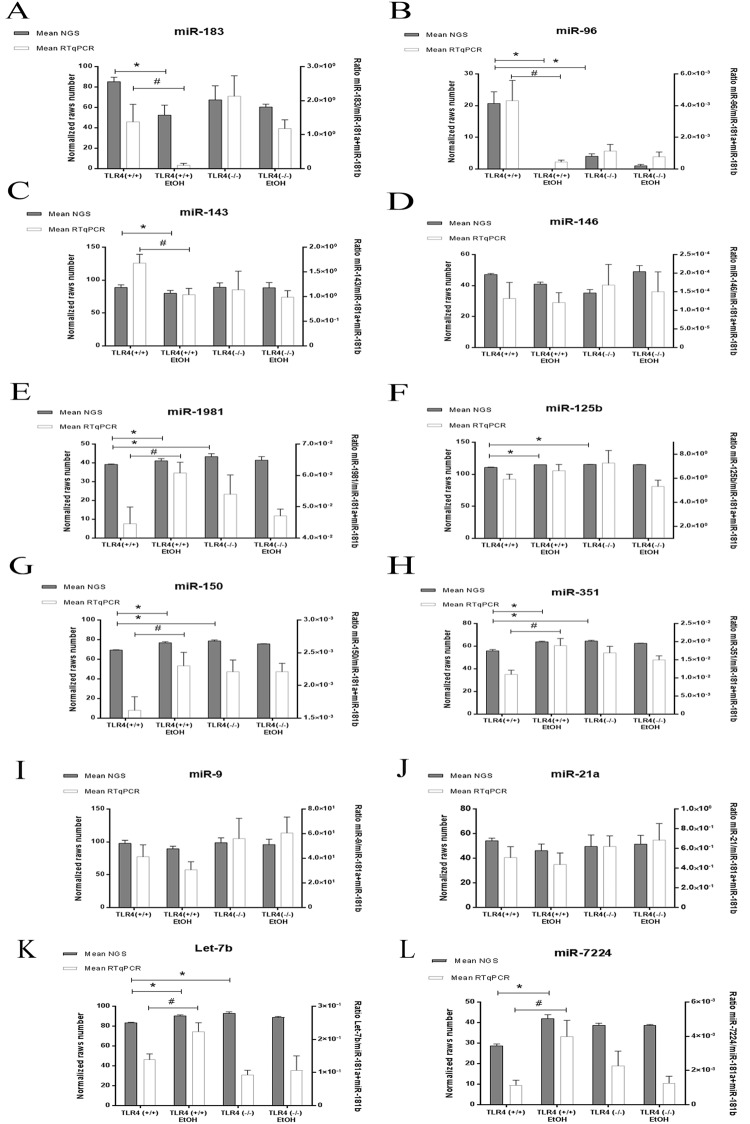
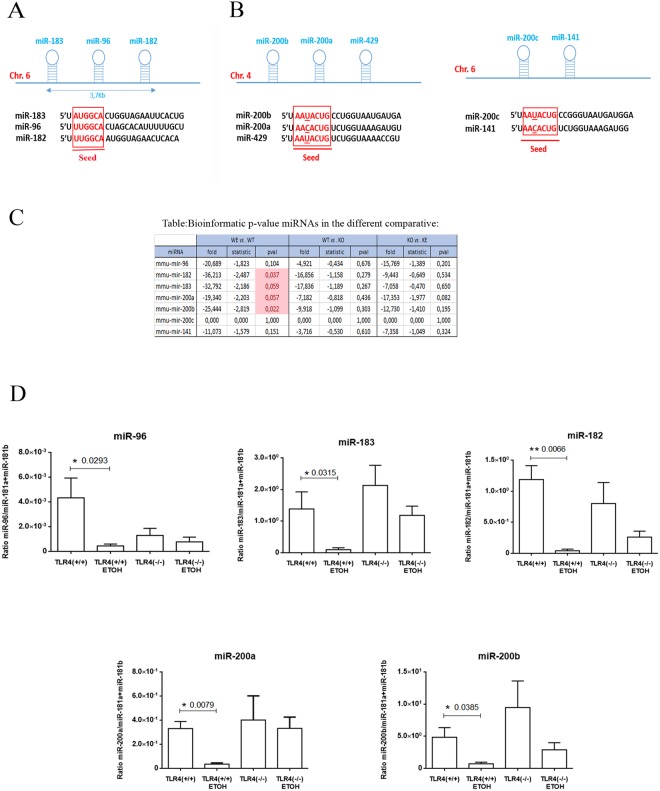
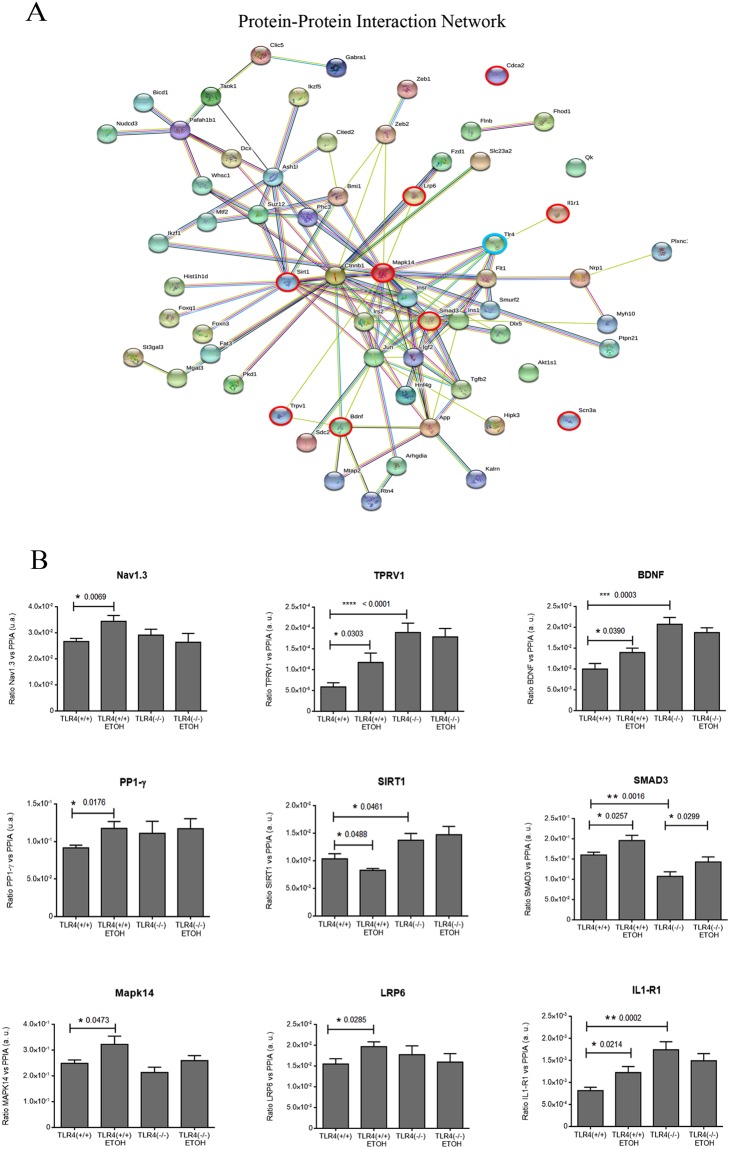
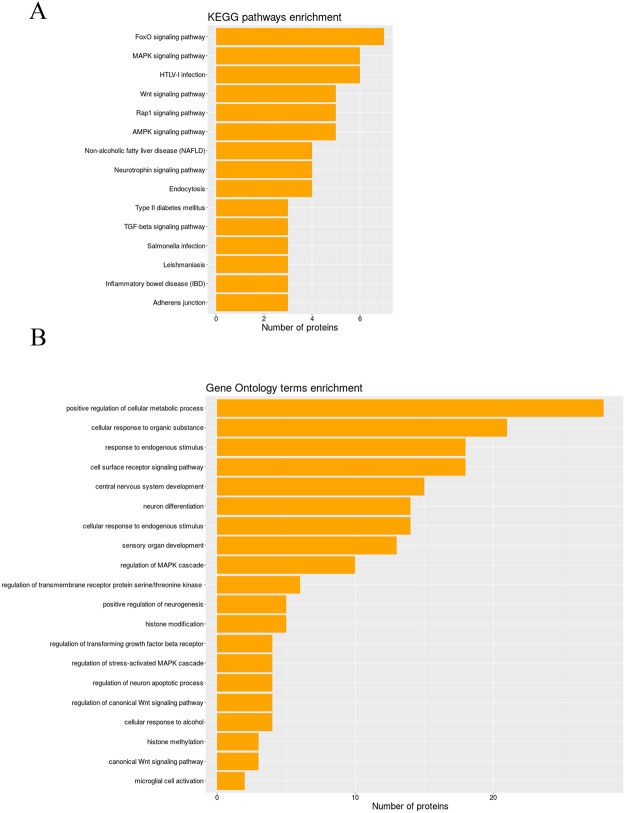
Alcohol abuse can induce brain injury and neurodegeneration, and recent evidence shows the participation of immune receptors toll-like in the neuroinflammation and brain damage. We evaluated the role of miRNAs as potential modulators of the neuroinflammation associated with alcohol abuse and the influence of the TLR4 response. Using mice cerebral cortex and next-generation sequencing (NGS), we identified miRNAs that were differentially expressed in the chronic alcohol-treated versus untreated WT or TLR4-KO mice. We observed a differentially expression of miR-183 Cluster (C) (miR-96/-182/-183), miR-200a and miR-200b, which were down-regulated, while mirR-125b was up-regulated in alcohol-treated WT versus (vs.) untreated mice. These miRNAs modulate targets genes related to the voltage-gated sodium channel, neuron hyperexcitability (Nav1.3, Trpv1, Smad3 and PP1-γ), as well as genes associated with innate immune TLR4 signaling response (Il1r1, Mapk14, Sirt1, Lrp6 and Bdnf). Functional enrichment of the miR-183C and miR-200a/b family target genes, revealed neuroinflammatory pathways networks involved in TLR4 signaling and alcohol abuse. The changes in the neuroinflammatory targets genes associated with alcohol abuse were mostly abolished in the TLR4-KO mice. Our results show the relationship between alcohol intake and miRNAs expression and open up new therapeutically targets to prevent deleterious effects of alcohol on the brain.
Conflict of interest statement
The authors declare no competing interests.
Figures
Similar articles
-
Lack of TLR4 modifies the miRNAs profile and attenuates inflammatory signaling pathways.PLoS One. 2020 Aug 11;15(8):e0237066. doi: 10.1371/journal.pone.0237066. eCollection 2020. PLoS One. 2020. PMID: 32780740 Free PMC article.
-
TLR4 participates in the transmission of ethanol-induced neuroinflammation via astrocyte-derived extracellular vesicles.J Neuroinflammation. 2019 Jul 4;16(1):136. doi: 10.1186/s12974-019-1529-x. J Neuroinflammation. 2019. PMID: 31272469 Free PMC article.
-
Chronic alcohol-induced microRNA-155 contributes to neuroinflammation in a TLR4-dependent manner in mice.PLoS One. 2013 Aug 9;8(8):e70945. doi: 10.1371/journal.pone.0070945. eCollection 2013. PLoS One. 2013. PMID: 23951048 Free PMC article.
-
miR-107: a toll-like receptor-regulated miRNA dysregulated in obesity and type II diabetes.J Leukoc Biol. 2012 Sep;92(3):521-7. doi: 10.1189/jlb.0312160. Epub 2012 May 29. J Leukoc Biol. 2012. PMID: 22645244 Review.
-
Toll-like receptor 4 stimulation initiates an inflammatory response that decreases cardiomyocyte contractility.Antioxid Redox Signal. 2011 Oct 1;15(7):1895-909. doi: 10.1089/ars.2010.3728. Epub 2011 Apr 21. Antioxid Redox Signal. 2011. PMID: 21126202 Review.
Cited by
-
A Review of Molecular Interplay between Neurotrophins and miRNAs in Neuropsychological Disorders.Mol Neurobiol. 2022 Oct;59(10):6260-6280. doi: 10.1007/s12035-022-02966-5. Epub 2022 Aug 2. Mol Neurobiol. 2022. PMID: 35916975 Free PMC article. Review.
-
Detrimental Effects of Alcohol-Induced Inflammation on Brain Health: From Neurogenesis to Neurodegeneration.Cell Mol Neurobiol. 2023 Jul;43(5):1885-1904. doi: 10.1007/s10571-022-01308-2. Epub 2022 Nov 27. Cell Mol Neurobiol. 2023. PMID: 36436159 Free PMC article. Review.
-
Defining Specific Cell States of MPTP-Induced Parkinson's Disease by Single-Nucleus RNA Sequencing.Int J Mol Sci. 2022 Sep 15;23(18):10774. doi: 10.3390/ijms231810774. Int J Mol Sci. 2022. PMID: 36142685 Free PMC article.
-
Light-responsive microRNA molecules in human retinal organoids are differentially regulated by distinct wavelengths of light.iScience. 2023 Jun 28;26(7):107237. doi: 10.1016/j.isci.2023.107237. eCollection 2023 Jul 21. iScience. 2023. PMID: 37485345 Free PMC article.
-
Molecular Toxicology and Pathophysiology of Comorbid Alcohol Use Disorder and Post-Traumatic Stress Disorder Associated with Traumatic Brain Injury.Int J Mol Sci. 2023 May 15;24(10):8805. doi: 10.3390/ijms24108805. Int J Mol Sci. 2023. PMID: 37240148 Free PMC article. Review.
References
Publication types
MeSH terms
Substances
LinkOut - more resources
Full Text Sources
Molecular Biology Databases
Research Materials
Miscellaneous
