

Introducing a Comprehensive Framework to Measure Spike-LFP Coupling
- PMID: 30374297
- PMCID: PMC6196284
- DOI: 10.3389/fncom.2018.00078
Introducing a Comprehensive Framework to Measure Spike-LFP Coupling
Abstract
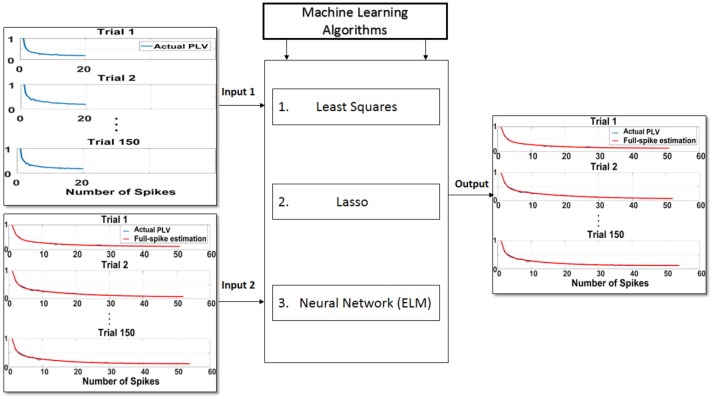
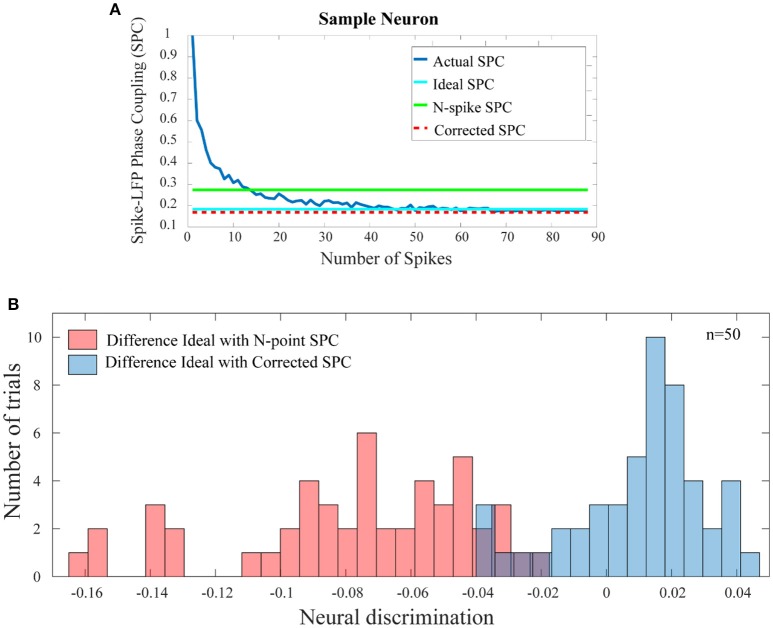
Measuring the coupling of single neuron's spiking activities to the local field potentials (LFPs) is a method to investigate neuronal synchronization. The most important synchronization measures are phase locking value (PLV), spike field coherence (SFC), pairwise phase consistency (PPC), and spike-triggered correlation matrix synchronization (SCMS). Synchronization is generally quantified using the PLV and SFC. PLV and SFC methods are either biased on the spike rates or the number of trials. To resolve these problems the PPC measure has been introduced. However, there are some shortcomings associated with the PPC measure which is unbiased only for very high spike rates. However evaluating spike-LFP phase coupling (SPC) for short trials or low number of spikes is a challenge in many studies. Lastly, SCMS measures the correlation in terms of phase in regions around the spikes inclusive of the non-spiking events which is the major difference between SCMS and SPC. This study proposes a new framework for predicting a more reliable SPC by modeling and introducing appropriate machine learning algorithms namely least squares, Lasso, and neural networks algorithms where through an initial trend of the spike rates, the ideal SPC is predicted for neurons with low spike rates. Furthermore, comparing the performance of these three algorithms shows that the least squares approach provided the best performance with a correlation of 0.99214 and R 2 of 0.9563 in the training phase, and correlation of 0.95969 and R 2 of 0.8842 in the test phase. Hence, the results show that the proposed framework significantly enhances the accuracy and provides a bias-free basis for small number of spikes for SPC as compared to the conventional methods such as PLV method. As such, it has the general ability to correct for the bias on the number of spike rates.
Keywords: local field potentials; pairwise phase consistency; phase locking value; spike field coherence; spike-LFP phase coupling.
Figures


Similar articles
-
Improved measures of phase-coupling between spikes and the Local Field Potential.J Comput Neurosci. 2012 Aug;33(1):53-75. doi: 10.1007/s10827-011-0374-4. Epub 2011 Dec 21. J Comput Neurosci. 2012. PMID: 22187161 Free PMC article.
-
Unbiased and robust quantification of synchronization between spikes and local field potential.J Neurosci Methods. 2016 Aug 30;269:33-8. doi: 10.1016/j.jneumeth.2016.05.004. Epub 2016 May 13. J Neurosci Methods. 2016. PMID: 27180930
-
Adaptation Modulates Spike-Phase Coupling Tuning Curve in the Rat Primary Auditory Cortex.Front Syst Neurosci. 2020 Aug 3;14:55. doi: 10.3389/fnsys.2020.00055. eCollection 2020. Front Syst Neurosci. 2020. PMID: 32848646 Free PMC article.
-
Supervised learning in spiking neural networks: A review of algorithms and evaluations.Neural Netw. 2020 May;125:258-280. doi: 10.1016/j.neunet.2020.02.011. Epub 2020 Feb 25. Neural Netw. 2020. PMID: 32146356 Review.
-
Comparing Open-Source Toolboxes for Processing and Analysis of Spike and Local Field Potentials Data.Front Neuroinform. 2019 Jul 30;13:57. doi: 10.3389/fninf.2019.00057. eCollection 2019. Front Neuroinform. 2019. PMID: 31417389 Free PMC article. Review.
Cited by
-
Electrophysiological damage to neuronal membrane alters ephaptic entrainment.Sci Rep. 2023 Jul 24;13(1):11974. doi: 10.1038/s41598-023-38738-x. Sci Rep. 2023. PMID: 37488148 Free PMC article.
-
Over and above frequency: Gamma oscillations as units of neural circuit operations.Neuron. 2023 Apr 5;111(7):936-953. doi: 10.1016/j.neuron.2023.02.026. Neuron. 2023. PMID: 37023717 Free PMC article. Review.
-
Measuring Synchronization between Spikes and Local Field Potential Based on the Kullback-Leibler Divergence.Comput Intell Neurosci. 2021 Sep 9;2021:9954302. doi: 10.1155/2021/9954302. eCollection 2021. Comput Intell Neurosci. 2021. PMID: 34539774 Free PMC article.
-
Spike-phase coupling of subthalamic neurons to posterior perisylvian cortex predicts speech sound accuracy.Nat Commun. 2025 Apr 9;16(1):3357. doi: 10.1038/s41467-025-58781-8. Nat Commun. 2025. PMID: 40204804 Free PMC article.
-
Sensory representation of visual stimuli in the coupling of low-frequency phase to spike times.Brain Struct Funct. 2022 Jun;227(5):1641-1654. doi: 10.1007/s00429-022-02460-7. Epub 2022 Feb 1. Brain Struct Funct. 2022. PMID: 35106628
References
-
- Abdi H. (2007). The Method of Least Squares. Thousand Oaks, CA: Encyclopedia of Measurement and Statistics.
-
- Boashash B. (1992). Estimating and interpreting the instantaneous frequency of a signal. II. Algorithms and applications. Proc. IEEE 80, 540–568. 10.1109/5.135378 - DOI
LinkOut - more resources
Full Text Sources
Research Materials