. 2018 Oct 15:9:2452.
doi: 10.3389/fmicb.2018.02452. eCollection 2018.

Comprehensive Longitudinal Microbiome Analysis of the Chicken Cecum Reveals a Shift From Competitive to Environmental Drivers and a Window of Opportunity for Campylobacter

Affiliations

Comprehensive Longitudinal Microbiome Analysis of the Chicken Cecum Reveals a Shift From Competitive to Environmental Drivers and a Window of Opportunity for Campylobacter

Umer Zeeshan Ijaz et al. Front Microbiol. .

Abstract

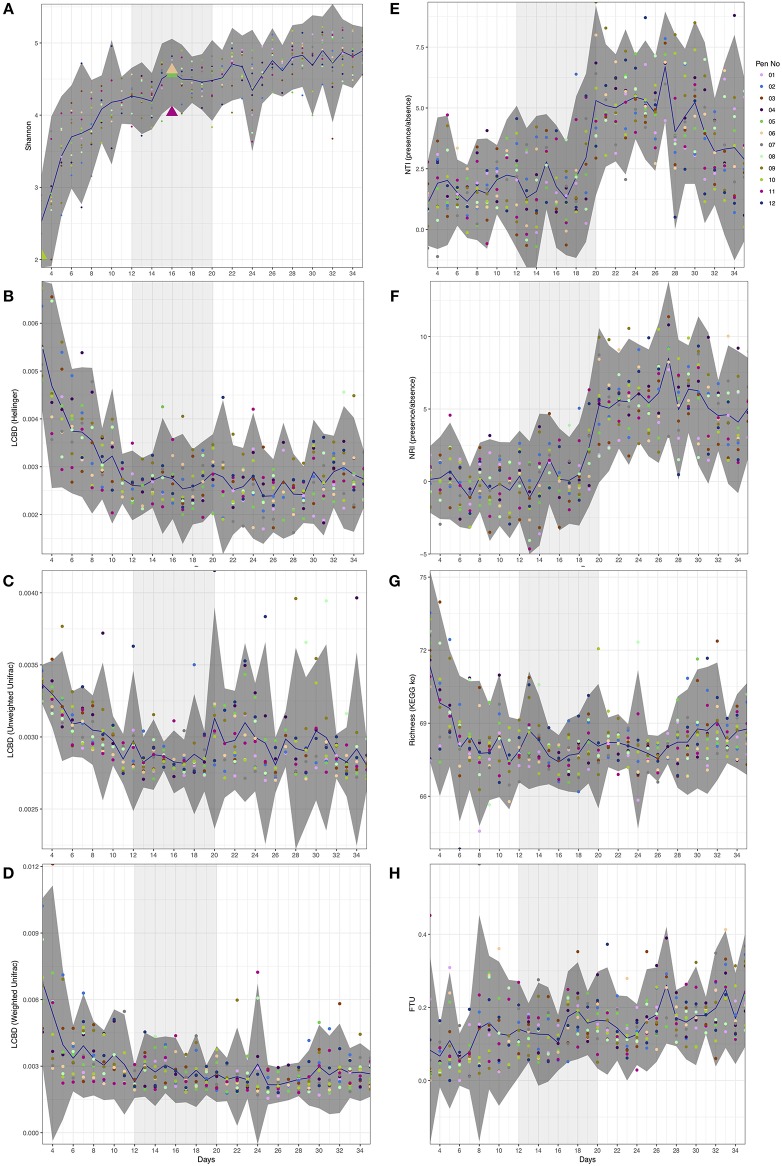
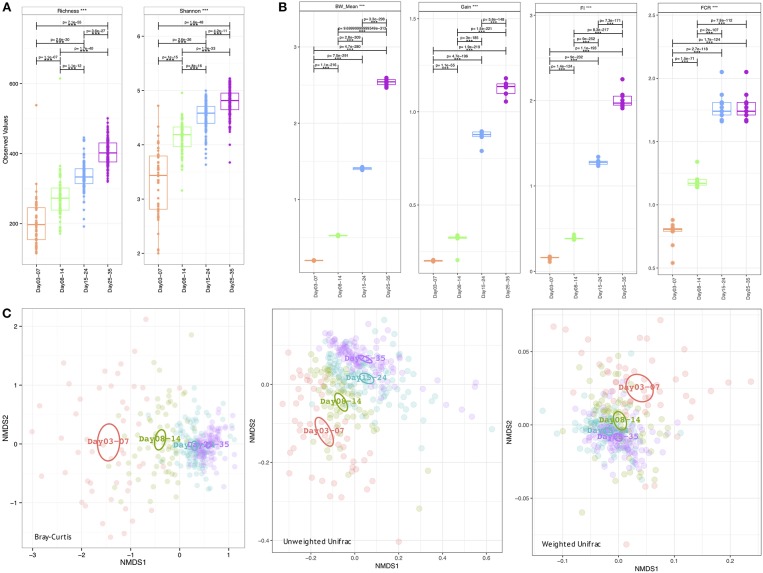
Chickens are a key food source for humans yet their microbiome contains bacteria that can be pathogenic to humans, and indeed potentially to chickens themselves. Campylobacter is present within the chicken gut and is the leading cause of bacterial foodborne gastroenteritis within humans worldwide. Infection can lead to secondary sequelae such as Guillain-Barré syndrome and stunted growth in children from low-resource areas. Despite the global health impact and economic burden of Campylobacter, how and when Campylobacter appears within chickens remains unclear. The lack of day to day microbiome data with replicates, relevant metadata, and a lack of natural infection studies have delayed our understanding of the chicken gut microbiome and Campylobacter. Here, we performed a comprehensive day to day microbiome analysis of the chicken cecum from day 3 to 35 (12 replicates each day; final n = 379). We combined metadata such as chicken weight and feed conversion rates to investigate what the driving forces are for the microbial changes within the chicken gut over time, and how this relates to Campylobacter appearance within a natural habitat setting. We found a rapidly increasing microbial diversity up to day 12 with variation observed both in terms of genera and abundance, before a stabilization of the microbial diversity after day 20. In particular, we identified a shift from competitive to environmental drivers of microbial community from days 12 to 20 creating a window of opportunity whereby Campylobacter can appear. Campylobacter was identified at day 16 which was 1 day after the most substantial changes in metabolic profiles observed. In addition, microbial variation over time is most likely influenced by the diet of the chickens whereby significant shifts in OTU abundances and beta dispersion of samples often corresponded with changes in feed. This study is unique in comparison to the most recent studies as neither sampling was sporadic nor Campylobacter was artificially introduced, thus the experiments were performed in a natural setting. We believe that our findings can be useful for future intervention strategies and help reduce the burden of Campylobacter within the food chain.

Keywords: Campylobacter; chicken; competitive exclusion; diversity; environmental filtering; microbiome; phylogenetic signal.


Figures

Figure 1
Figure 1
Day-wise statistical measures calculated on the microbiome data. (A) Shannon entropy with first appearance of Campylobacter (≥5 sequences) highlighted as triangles. (B–D) Local contribution to beta diversity (LCBD) calculated by using Hellinger transform on the microbial counts, Unweighted Unifrac dissimilarity (phylogenetic distances only), and Weighted Unifrac dissimilarity (phylogenetic distances weighted with abundance counts) respectively (E,F) Nearest-Taxon-Index (NTI) and nearest-relative-index (NRI) considering presence/absence of OTUs in samples (G) Richness calculated as exponentiation of Shannon entropy on the proportional representation of KEGG pathways on samples, and (H) fraction-of-taxonomic-units-unexplained (FTU) calculated on each sample. In all subfigures, the mean value is represented by solid blue line with 95% confidence interval of standard deviation given as dark shaded region around the mean. The samples are colored with respect to the pens they originate from. Based on the analysis given in this study, we have identified days 12–20 of importance and are thus highlighted as lighter shaded regions.
Figure 2
Figure 2
Week-wise measures calculated on the microbiome data (A) Alpha diversity measures: richness (after rarefying the samples to minimum library size) and Shannon entropy (B) Extrinsic parameters calculated on weekly basis were mean body weight (BW_mean), body weight gain (Gain), feed intake (FI), feed conversion ratio (FCR), and (C) Beta diversity measures using Bray-Curtis (counts), Unweighted Unifrac (phylogenetic distance), and Weighted Unifrac (phylogenetic distance weighted by abundance counts). In (A,B) we have performed pair-wise ANOVA and where significant the pairs were connected with p-values drawn on top. In (C) the ellipses represent the 95% confidence interval of the standard error of the ordination points of a given grouping with labels drawn at the center (mean) of the ordination points.
Figure 3
Figure 3
Phylogenetic tree of the subset of OTUs selected as significant on differential analysis (based on Table 3 and Supplementary Table 1). Next to the OTU labels are descriptive text representing where the OTUs were found to be significant, for example, the first entry for OTU 231, “u 26-27 d 27-28 u 30-31,” can be read as upregulated going from day 26 to 27 and then from day 30 to 31 and downregulated going from day 27 to 28. “b” represents the OTUs selected in the subset analysis. The next two columns are a pictorial representation of the above-mentioned descriptive text with pink color representing OTUs selected in subset analysis, red color for upregulated OTUs, blue for downregulated OTUs, and purple for OTUs which show the both trends (up/down regulation). The next column shows the taxonomy of the OTUs according to SILVA v123 with coloring at unique family level. The heatmap was drawn by collating the mean values of OTUs for samples from the same day after performing proportional standardization on the full OTU table using wisconsin() function.

References

    1. Amour C., Gratz J., Mduma E., Svensen E., Rogawski E. T., Mcgrath M., et al. (2016). Epidemiology and impact of campylobacter infection in children in 8 low-resource settings: results from the MAL-ED study. Clin. Infect. Dis. 63, 1171–1179. 10.1093/cid/ciw542 - DOI - PMC - PubMed
    1. Apajalahti J. (2005). Comparative gut microflora, metabolic challenges, and potential opportunities. J. Appl. Poult. Res. 14, 444–453. 10.1093/japr/14.2.444 - DOI
    1. Asshauer K. P., Meinicke P. (2013). On the estimation of metabolic profiles in metagenomics, in German Conference on Bioinformatics 2013, eds Beissbarth T., Kollmar M., Leha A., Morgenstern B., Schultz A., Waack S., Wingender E. (Dagstuhl: Schloss Dagstuhl–Leibniz-Zentrum fuer Informatik; ), 1–13.
    1. Aßhauer K. P., Wemheuer B., Daniel R., Meinicke P. (2015). Tax4Fun: predicting functional profiles from metagenomic 16S rRNA data. Bioinformatics 31, 2882–2884. 10.1093/bioinformatics/btv287 - DOI - PMC - PubMed
    1. Ballou A. L., Ali R. A., Mendoza M. A., Ellis J. C., Hassan H. M., Croom W. J., et al. (2016). Development of the chick microbiome: how early exposure influences future microbial diversity. Front. Vet. Sci. 3:2. 10.3389/fvets.2016.00002 - DOI - PMC - PubMed

LinkOut - more resources