

Incomplete lineage sorting rather than hybridization explains the inconsistent phylogeny of the wisent
- PMID: 30374461
- PMCID: PMC6195592
- DOI: 10.1038/s42003-018-0176-6
Incomplete lineage sorting rather than hybridization explains the inconsistent phylogeny of the wisent
Abstract
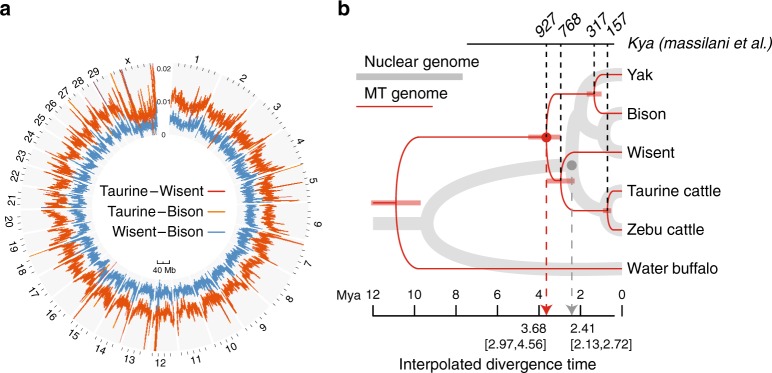
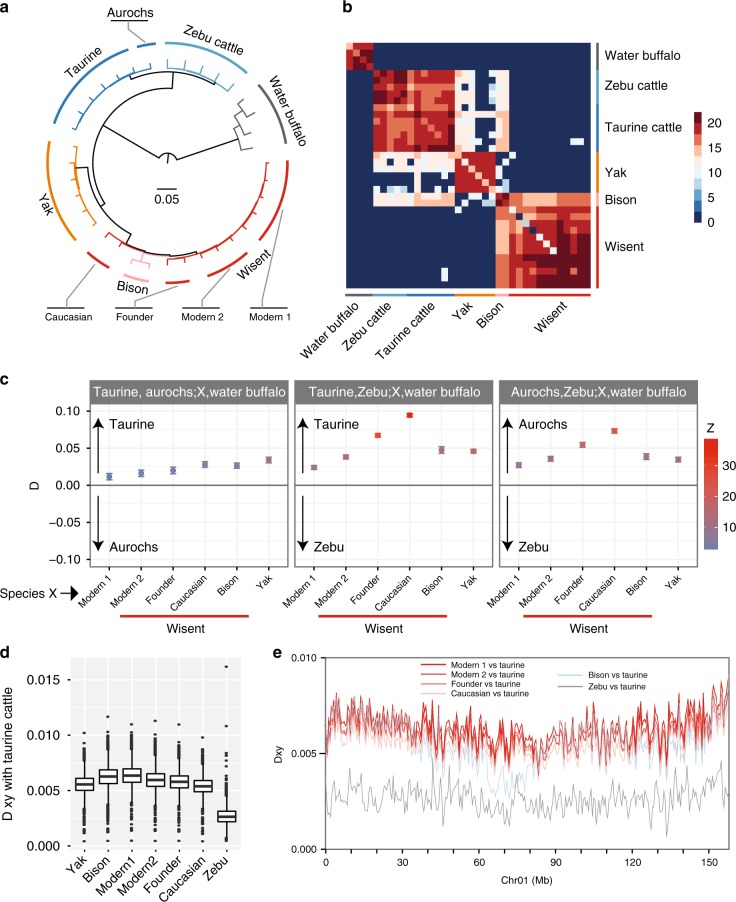
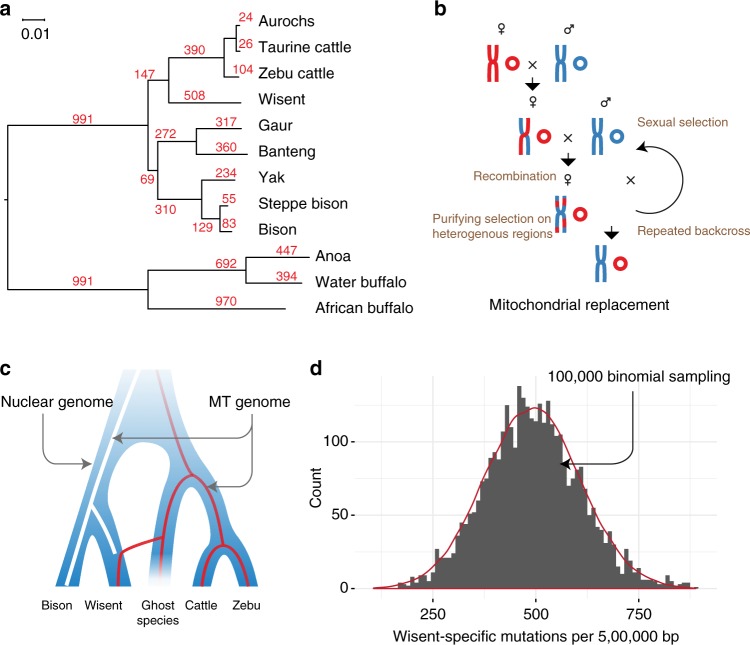
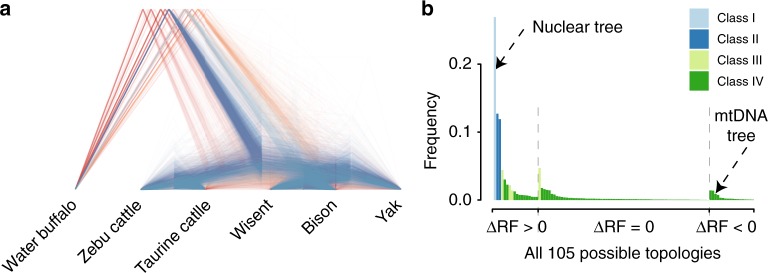
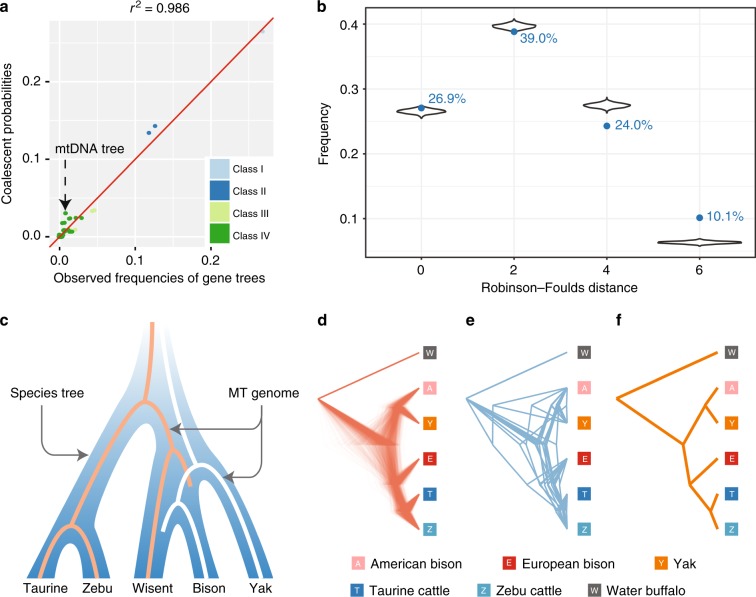
The wisent or European bison is the largest European herbivore and is completely cross-fertile with its American relative. However, mtDNA genome of wisent is similar to that of cattle, which suggests that wisent emerged as a hybrid of bison and an extinct cattle-like species. Here, we analyzed nuclear whole-genome sequences of the bovine species, and found only a minor and recent gene flow between wisent and cattle. Furthermore, we identified an appreciable heterogeneity of the nuclear gene tree topologies of the bovine species. The relative frequencies of various topologies, including the mtDNA topology, were consistent with frequencies of incomplete lineage sorting (ILS) as estimated by tree coalescence analysis. This indicates that ILS has occurred and may well account for the anomalous wisent mtDNA phylogeny as the outcome of a rare event. We propose that ILS is a possible explanation of phylogenomic anomalies among closely related species.
Conflict of interest statement
The authors declare no competing interests.
Figures
Similar articles
-
Maternal and paternal lineages in cross-breeding bovine species. Has wisent a hybrid origin?Mol Biol Evol. 2004 Jul;21(7):1165-70. doi: 10.1093/molbev/msh064. Epub 2004 Jan 22. Mol Biol Evol. 2004. PMID: 14739241
-
Deciphering the Wisent Demographic and Adaptive Histories from Individual Whole-Genome Sequences.Mol Biol Evol. 2016 Nov;33(11):2801-2814. doi: 10.1093/molbev/msw144. Epub 2016 Jul 19. Mol Biol Evol. 2016. PMID: 27436010 Free PMC article.
-
Tracking of wisent-bison-yak mitochondrial evolution.J Appl Genet. 2012 Aug;53(3):317-22. doi: 10.1007/s13353-012-0090-4. Epub 2012 Mar 14. J Appl Genet. 2012. PMID: 22415349 Free PMC article.
-
Delimiting Coalescence Genes (C-Genes) in Phylogenomic Data Sets.Genes (Basel). 2018 Feb 26;9(3):123. doi: 10.3390/genes9030123. Genes (Basel). 2018. PMID: 29495400 Free PMC article. Review.
-
Estimating phylogenetic trees from genome-scale data.Ann N Y Acad Sci. 2015 Dec;1360:36-53. doi: 10.1111/nyas.12747. Epub 2015 Apr 14. Ann N Y Acad Sci. 2015. PMID: 25873435 Review.
Cited by
-
Testing assertions of widespread introgressive hybridization in a clade of neotropical toads with low mate selectivity (Rhinella granulosa species group).Heredity (Edinb). 2023 Jan;130(1):14-21. doi: 10.1038/s41437-022-00571-9. Epub 2022 Nov 5. Heredity (Edinb). 2023. PMID: 36333595 Free PMC article.
-
Inferring phylogenetic structure, taxa hybridization, and divergence times within rock voles of subgenus Aschizomys (Cricetidae: Alticola) using quaddRAD sequencing and a cytb dataset.Ecol Evol. 2023 Dec 13;13(12):e10742. doi: 10.1002/ece3.10742. eCollection 2023 Dec. Ecol Evol. 2023. PMID: 38094151 Free PMC article.
-
Phylogenomic approaches untangle early divergences and complex diversifications of the olive plant family.BMC Biol. 2022 Apr 25;20(1):92. doi: 10.1186/s12915-022-01297-0. BMC Biol. 2022. PMID: 35468824 Free PMC article.
-
Genomic evaluation of hybridization in historic and modern North American Bison (Bison bison).Sci Rep. 2022 Apr 16;12(1):6397. doi: 10.1038/s41598-022-09828-z. Sci Rep. 2022. PMID: 35430616 Free PMC article.
-
The taxonomy of the Trichophyton rubrum complex: a phylogenomic approach.Microb Genom. 2021 Nov;7(11):000707. doi: 10.1099/mgen.0.000707. Microb Genom. 2021. PMID: 34730487 Free PMC article.
References
-
- Avise, J. C. Phylogeography: The History and Formation of Species (Harvard University Press, Cambridge, 2000).
-
- Funk DJ, Omland KE. Species-level paraphyly and polyphyly: frequency, causes, and consequences, with insights from animal mitochondrial DNA. Annu. Rev. Ecol. Evol. Syst. 2003;34:397–423. doi: 10.1146/annurev.ecolsys.34.011802.132421. - DOI
LinkOut - more resources
Full Text Sources
Molecular Biology Databases
