. 2018 Oct 30;9(1):4528.
doi: 10.1038/s41467-018-06912-9.

Sources, propagation and consequences of stochasticity in cellular growth

Affiliations

Sources, propagation and consequences of stochasticity in cellular growth

Philipp Thomas et al. Nat Commun. .

Abstract

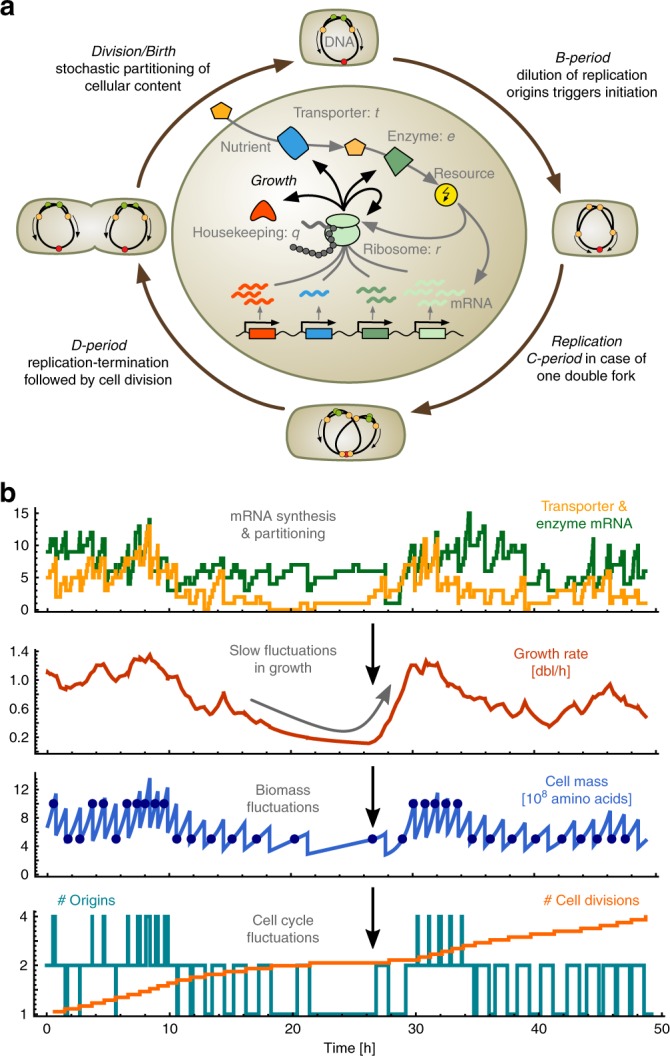
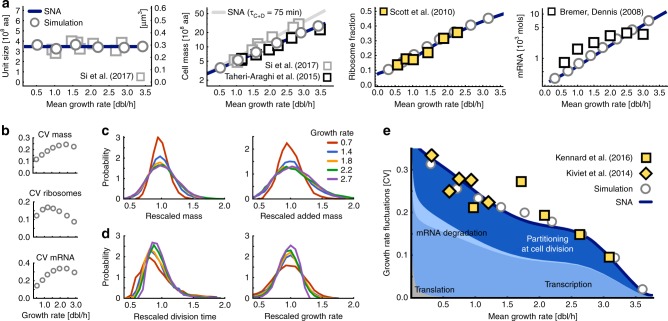
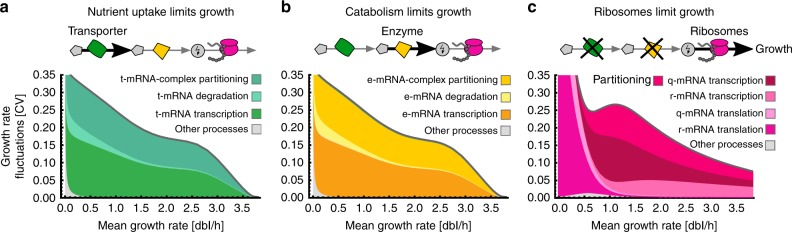
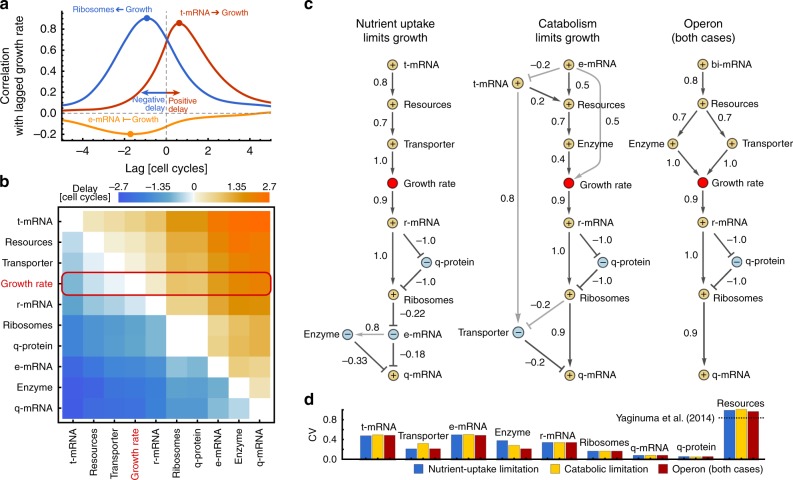
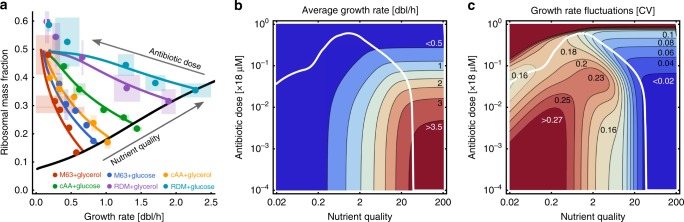
Growth impacts a range of phenotypic responses. Identifying the sources of growth variation and their propagation across the cellular machinery can thus unravel mechanisms that underpin cell decisions. We present a stochastic cell model linking gene expression, metabolism and replication to predict growth dynamics in single bacterial cells. Alongside we provide a theory to analyse stochastic chemical reactions coupled with cell divisions, enabling efficient parameter estimation, sensitivity analysis and hypothesis testing. The cell model recovers population-averaged data on growth-dependence of bacterial physiology and how growth variations in single cells change across conditions. We identify processes responsible for this variation and reconstruct the propagation of initial fluctuations to growth and other processes. Finally, we study drug-nutrient interactions and find that antibiotics can both enhance and suppress growth heterogeneity. Our results provide a predictive framework to integrate heterogeneous data and draw testable predictions with implications for antibiotic tolerance, evolutionary and synthetic biology.


Conflict of interest statement

The authors declare no competing interests.

Figures

Fig. 1
Fig. 1
Stochastic model of single-cell growth. a The outer cycle illustrates the cell cycle model based on the Cooper–Helmstetter model of bacterial replication. We assume initiation of a new round of replication at a fixed concentration of DNA-origins, analogous to a fixed initiation mass per DNA-origin, thus growth dynamics schedule the replication events and are determined by the intracellular model (inner circle). The latter describes import and metabolism of resources, and how they fuel gene expression, where the rate of protein-biosynthesis determines growth. Stochasticity of cellular dynamics is a result of the intrinsic stochasticity of the various reactions and the random partitioning of the cellular content at division. b Stochastic simulations illustrate the propagation of intrinsic fluctuations in single cells: mRNAs are synthesised at low numbers per cell (yellow & green lines), which affects protein production and so growth rate (red line). Fluctuations in growth lead to temporal variations in cell mass that can span several cell cycles (blue line), causing fluctuations in the number of replication origins (teal line), in the mass at initiation (filled circles), and consequently in cell divisions (orange line)
Fig. 2
Fig. 2
Stochastic model predicts condition-dependence of growth in single cells. a Our model recovers bacterial growth laws. Cell mass per number of origins (unit size) is constant in all growth conditions. Absolute cell mass, ribosome content and total mRNA numbers per cell increase with average growth rates. Measurements used for model parameterisation (yellow markers), measurements validating model predictions (white markers); stochastic simulations (circles) validate the approximations (SNA, lines). A longer C+D-period of 75 min yields higher mass (grey line). Consistent with Scott et al. and Kennard et al., we changed growth rate by varying nutrient quality (ns in Eq. (8)). Varying transporter or enzyme levels as in Kiviet et al. has a qualitatively similar effect (Supplementary Fig. 4). b Fluctuations in cell mass, measured by the coefficient of variation (CV), initially increase as a function of average growth rate. Fluctuations of ribosomal mass fraction are of the order of 10–20%, and those of total mRNA concentrations largely follow the trend of the mass CV. c Single-cell distributions of cell mass at birth and mass added between birth and division are invariant when rescaled by their means. For intermediate to fast growth conditions (1.4–2.7 doublings per hour) distributions collapse nearly perfectly, consistent with the stable CV in this growth regime (b). Slowly growing cells (0.7 red line) deviate from this universal behaviour. d Rescaled distributions of doubling times and growth rates broaden gradually with decreasing medium quality, i.e. the quantities are condition-dependent at the single-cell level. e Our model quantitatively recovers variations over the whole range of experimentally accessible growth rates. Stochastic simulations (grey circles) and the small noise approximation (SNA, solid blue line) predict that fast growing cells display less growth variability than slow-growing cells, consistent with experimental observations (diamonds, squares). Colours indicate the contributions of different cellular processes to growth variations: synthesis, degradation and random partitioning of mRNAs at cell division. Contributions from other processes such as protein translation are overall small (grey area)
Fig. 3
Fig. 3
Growth limitations determine the sources of growth fluctuations. a Fluctuations in transcription of transporter mRNAs and their stochastic partitioning dominate growth variability when nutrient uptake is growth-limiting (import rate < enzymatic rate, see Supplementary Table 1). Other processes such as translation of proteins are largely negligible. b When catabolism limits growth (import rate > enzymatic rate), fluctuations in enzymatic mRNAs instead explain most of the observed variation. We vary catabolic turnover rates vm relative to nutrient uptake rate vt. c In a reduced model with constant supply of resources, ribosome production limits growth. Growth variability results from transcription, translation and partitioning of lowly abundant r- and q-mRNAs
Fig. 4
Fig. 4
Cross-correlation analysis reveals the propagation of fluctuations. a Concentrations of transporter mRNA (t-mRNA) correlate positively with growth rate at later times (red line, maximum correlation at positive lag) indicating that they increase growth rate. Ribosome concentrations correlate positively with growth at earlier times (blue line, maximum correlation at negative lag) indicating that they are increased by growth rate. Concentrations of enzymatic mRNA (e-mRNA) correlate negatively, indicating that they are mainly diluted by growth (yellow line, minimum correlation at negative lag). b Pairwise delays between cellular components and growth rate (red box), ordered by their delay with respect to growth rate, computed in moderate growth conditions (1.4 dbl/hr). c Minimal delay graphs illustrate the information flow under growth limitations with comparable growth rates. A dark arrow from species A to B indicates that B has minimal delay from A, suggesting that species B is the first to receive fluctuations from species A. Arrows denote positive correlations at the delay, T-arrows negative correlations, and labels denote the delayed-correlation coefficient. Light arrows indicate components with second smallest delay whenever these are not reached through subsequent steps. The graph reveals cellular components up- and downstream of growth rate, i.e. those that affect growth and those affected by growth. When nutrient-uptake is limiting growth, t-mRNA act as a source of fluctuations, while for catabolic limitation e-mRNA are the dominant source (cf. Fig. 3). The corresponding proteins are upstream of growth and transmit fluctuations to growth rate. When transporters and enzymes are co-expressed from an operon the different limitations are indistinguishable. In all cases, q-mRNAs act as a sink due to their negative autoregulation, q-proteins are mainly diluted (nodes labelled with − correlate negatively with growth) while most species increase with growth (nodes labelled with + correlate positively with growth). d Fluctuations (CV) in concentrations of the transcriptome, proteome and resources are comparable across the considered cases. The dashed line indicates measured fluctuations in intracellular ATP
Fig. 5
Fig. 5
Condition-dependence of antibiotic responses. a Ribosomal content per cell as a function of average growth rate after treatment with chloramphenicol. Predictions (solid lines) are in quantitative agreement with experimental data (dots, shaded areas denote standard deviations over replicates and colours denote different nutrient conditions). b For any given nutrient condition the average growth rate is predicted to decrease monotonically with antibiotic dose. c Growth heterogeneity is predicted to be highly complex in a both nutrient- and dose-dependent manner. In nutrient-rich conditions growth heterogeneity increases with antibiotic dose, while in intermediate and poor conditions the response is non-monotonic. Over a large range of nutrient conditions there exists a non-zero drug dose that minimises growth heterogeneity (solid white line, b, c)

References

    1. Kiviet DJ, et al. Stochasticity of metabolism and growth at the single-cell level. Nature. 2014;514:376–379. doi: 10.1038/nature13582. - DOI - PubMed
    1. Taheri-Araghi S, et al. Cell-size control and homeostasis in bacteria. Curr. Biol. 2015;25:385–391. doi: 10.1016/j.cub.2014.12.009. - DOI - PMC - PubMed
    1. Kennard AS, et al. Individuality and universality in the growth-division laws of single E. coli cells. Phys. Rev. E. 2016;93:012408. doi: 10.1103/PhysRevE.93.012408. - DOI - PubMed
    1. Wallden M, Fange D, Lundius EG, Baltekin Ouml, Elf J. The synchronization of replication and division cycles in individual E. coli cells. Cell. 2016;166:729–739. doi: 10.1016/j.cell.2016.06.052. - DOI - PubMed
    1. Priestman, M., Thomas, P., Robertson, B. D. & Shahrezaei, V. Mycobacteria Modify Their Cell Size Control under Sub-Optimal Carbon Sources. Front. Cell Dev. Biol.5, 64 (2017). - PMC - PubMed

Publication types