. 2018 Oct 30;9(1):4526.
doi: 10.1038/s41467-018-06977-6.

The DNA binding landscape of the maize AUXIN RESPONSE FACTOR family

Affiliations

The DNA binding landscape of the maize AUXIN RESPONSE FACTOR family

Mary Galli et al. Nat Commun. .

Abstract

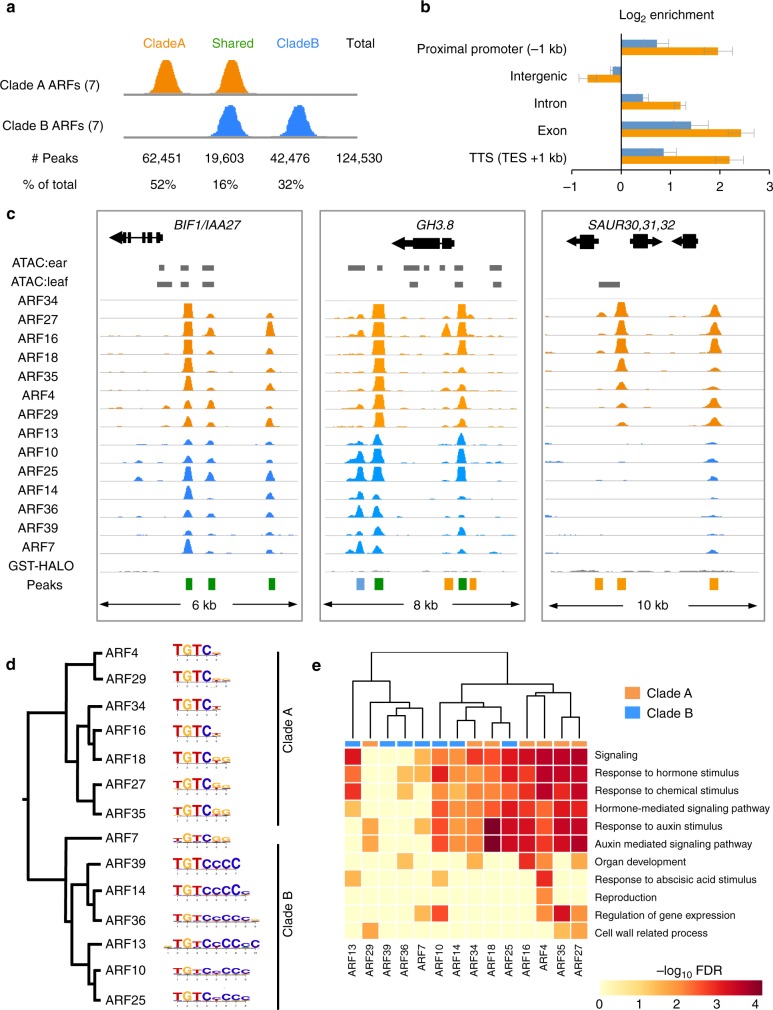
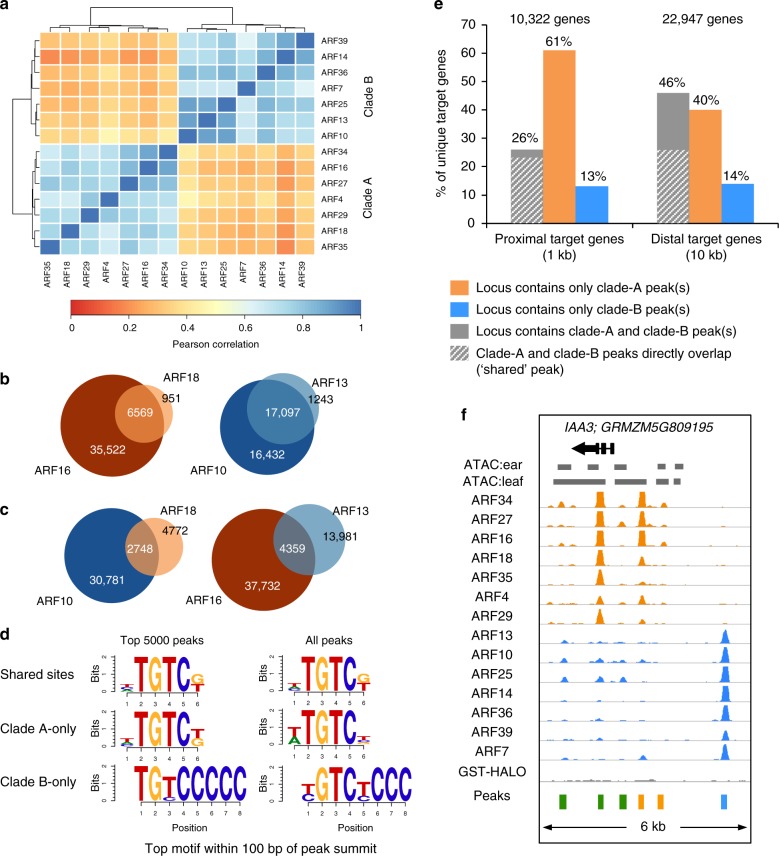
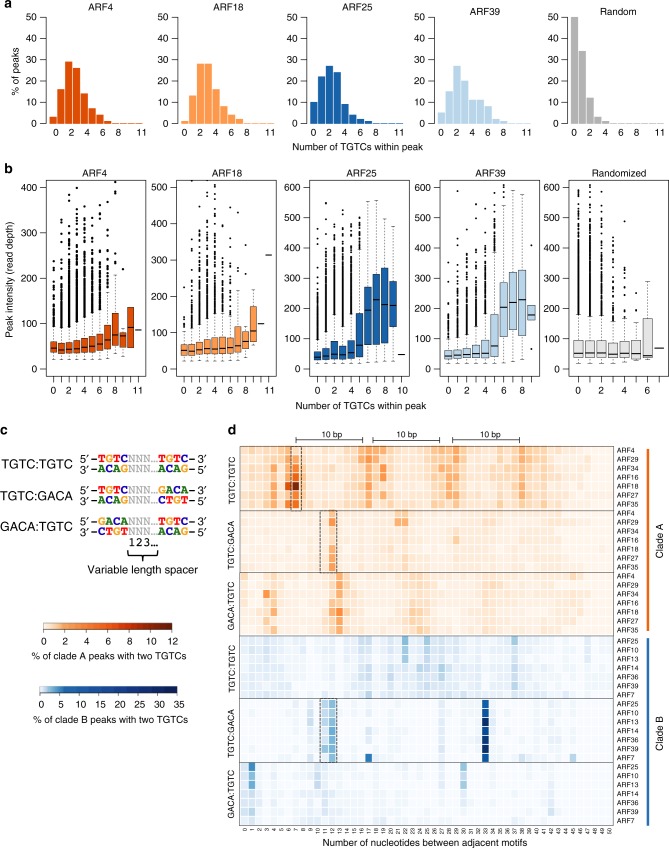
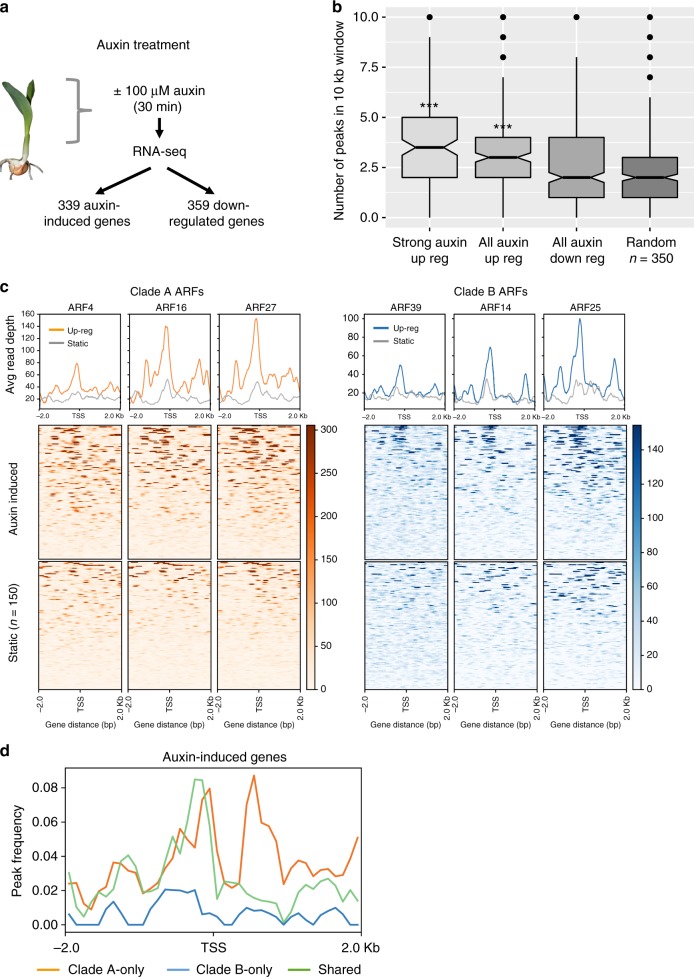
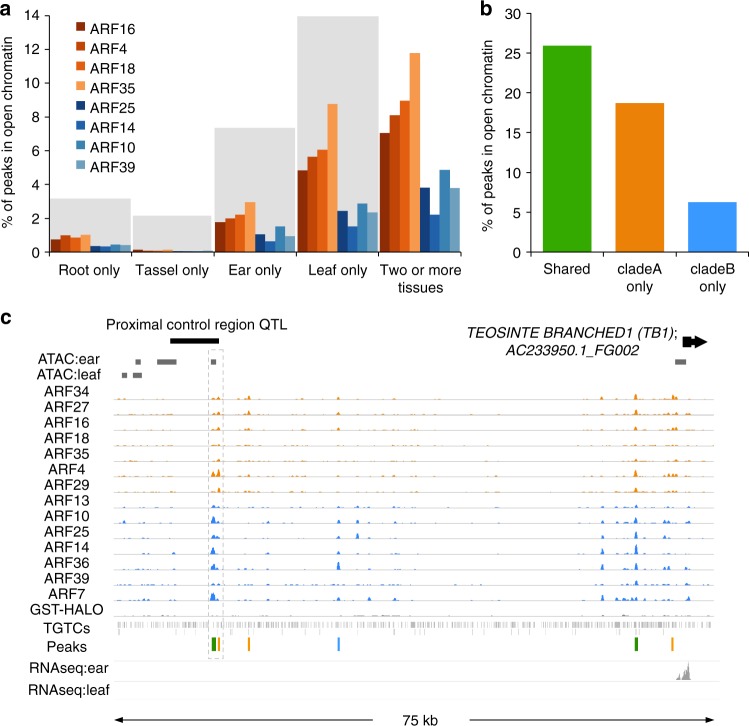
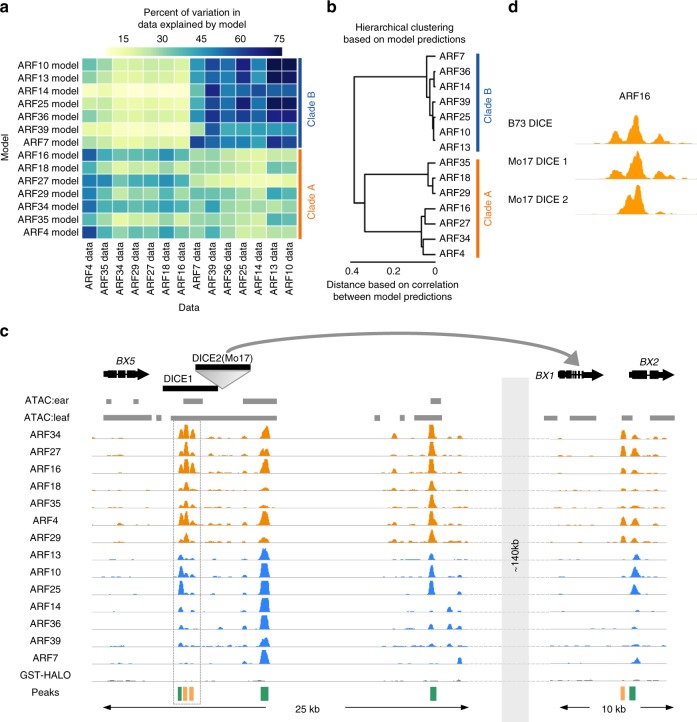
AUXIN RESPONSE FACTORS (ARFs) are plant-specific transcription factors (TFs) that couple perception of the hormone auxin to gene expression programs essential to all land plants. As with many large TF families, a key question is whether individual members determine developmental specificity by binding distinct target genes. We use DAP-seq to generate genome-wide in vitro TF:DNA interaction maps for fourteen maize ARFs from the evolutionarily conserved A and B clades. Comparative analysis reveal a high degree of binding site overlap for ARFs of the same clade, but largely distinct clade A and B binding. Many sites are however co-occupied by ARFs from both clades, suggesting transcriptional coordination for many genes. Among these, we investigate known QTLs and use machine learning to predict the impact of cis-regulatory variation. Overall, large-scale comparative analysis of ARF binding suggests that auxin response specificity may be determined by factors other than individual ARF binding site selection.


Conflict of interest statement

The authors declare no competing interests.

Figures

Fig. 1
Fig. 1
ARF binding events are biologically relevant. a Total number of clade A (orange) and clade B (blue) ARF peaks identified. b Log2 fold enrichment of peaks relative to gene features. Error bars show standard deviation. c ARF peaks are located in putative regulatory regions of known auxin responsive genes. GST-HALO track indicates reads from negative control. Regions of accessible chromatin in immature ears and young leaves as determined by ATAC-seq are depicted as gray bars. Colored bars at bottom correspond to called peaks; orange, clade A ARF; blue, clade B ARF; green, peak called in both clade A and B datasets. d Top motif identified for each ARF. Dendrogram based on ARF amino acid sequence similarity. e Predicted ARF target genes are enriched for functional GO terms related to auxin and other responses
Fig. 2
Fig. 2
Clade A and clade B ARFs bind to unique and shared sites. a Heatmap showing Pearson correlation of ARF binding events among each ARF dataset. b, c Venn diagrams showing peak overlap between representative clade A ARFs (orange) and clade B ARFs (blue). Numeric values show number of peaks. d Top motif identified for shared, clade A-only, or clade B-only sites. e Percentage of unique proximal (left) and distal (right) putative target genes that contain clade A, clade B, or both peaks. f IAA3 locus targeted by both clade A and B ARFs
Fig. 3
Fig. 3
ARF peaks frequently contain multiple TGTC repeats. a Percentage of total peaks containing different numbers of TGTCs within each peak for four representative ARF datasets and randomly selected regions (gray). b Distribution of peak signal intensity (read depth) for peaks containing different numbers of TGTCs. Four representative ARFs and randomly shuffled signal values assigned to random regions (gray) are shown. Central line represents median; upper and lower hinges show first and third quartiles. c Schematic showing the three possible TGTC repeat orientations and the numbering system used to describe the number of nucleotides separating the two motifs. d Percentage of peaks containing two adjacent TGTCs in the three orientations that contain the indicated number of nucleotides separating adjacent motifs. Black bars highlight 10 bp phasing
Fig. 4
Fig. 4
Early auxin-induced genes contain ARF peaks proximal to the TSS. a Schematic of auxin induction experiment. b Auxin-induced genes have a small but significantly greater number of ARF peaks located within 10 kb relative to random genes. *** indicates p-value <3.8e−7, pairwise t-test; central line shows median, upper, and lower hinges show first and third quartiles, notches show 95% confidence intervals. c Representative examples of clade A and clade B ARFs showing increased binding in regions proximal to the TSS for auxin-induced genes relative to a similar number of randomly selected genes. d The increase in peak frequency near the TSS of auxin-induced genes can be attributed to sites bound by only clade A ARFs or bound by both clade A and clade B ARFs (shared peaks)
Fig. 5
Fig. 5
ARF peaks overlap with regions of open chromatin. a Overlap of DAP-seq peaks with open chromatin regions from different tissues. Gray bars represent coverage of open chromatin datasets relative to leaf dataset (ATAC-seq plus MNase datasets which contained the greatest coverage). Clade A ARFs (orange), clade B ARFs (blue) b. Percentage of peaks for the shared, clade A-only, and clade B-only peak types that overlapped with a region of open chromatin found in at least one of four different tissue types. c Genome browser screenshot showing overlap of ear-specific region of open chromatin and ARF peaks (gray dashed box) in the proximal control region of the upstream TB1 QTL
Fig. 6
Fig. 6
ARFs display predictive cis-regulatory signatures. a Heatmap showing percent of variation in ARF binding data that can be explained by a machine learning model trained on individual ARF datasets. b Hierarchical clustering of ARFs based on model predictions. c Genome browser view of ARF binding events in the 30 kb region surrounding the DICE element and the BX1 genic region located 140 kb downstream that is controlled by DICE. d Empirically determined ARF16 peaks located in the B73 DICE, Mo17 DICE 1, and Mo17 DICE 2 elements as determined by DAP-seq

References

    1. Weijers D, Wagner D. Transcriptional responses to the auxin hormone. Annu. Rev. Plant Biol. 2016;67:539–574. doi: 10.1146/annurev-arplant-043015-112122. - DOI - PubMed
    1. Bargmann BOR, et al. A map of cell type-specific auxin responses. Mol. Syst. Biol. 2014;9:688–688. doi: 10.1038/msb.2013.40. - DOI - PMC - PubMed
    1. Lavy M, et al. Constitutive auxin response in Physcomitrella reveals complex interactions between Aux/IAA and ARF proteins. Elife. 2016;5:e13325. doi: 10.7554/eLife.13325. - DOI - PMC - PubMed
    1. Roosjen M, Paque S, Weijers D. Auxin response factors: output control in auxin biology. J. Exp. Bot. 2017;69:179–188. doi: 10.1093/jxb/erx237. - DOI - PubMed
    1. Finet C, Berne-Dedieu A, Scutt CP, Marlétaz F. Evolution of the ARF gene family in land plants: old domains, new tricks. Mol. Biol. Evol. 2013;30:45–56. doi: 10.1093/molbev/mss220. - DOI - PubMed

Publication types

MeSH terms