. 2018 Oct 30;9(1):4435.
doi: 10.1038/s41467-018-06639-7.

Cardiomyocyte gene programs encoding morphological and functional signatures in cardiac hypertrophy and failure

Affiliations

Cardiomyocyte gene programs encoding morphological and functional signatures in cardiac hypertrophy and failure

Seitaro Nomura et al. Nat Commun. .

Abstract

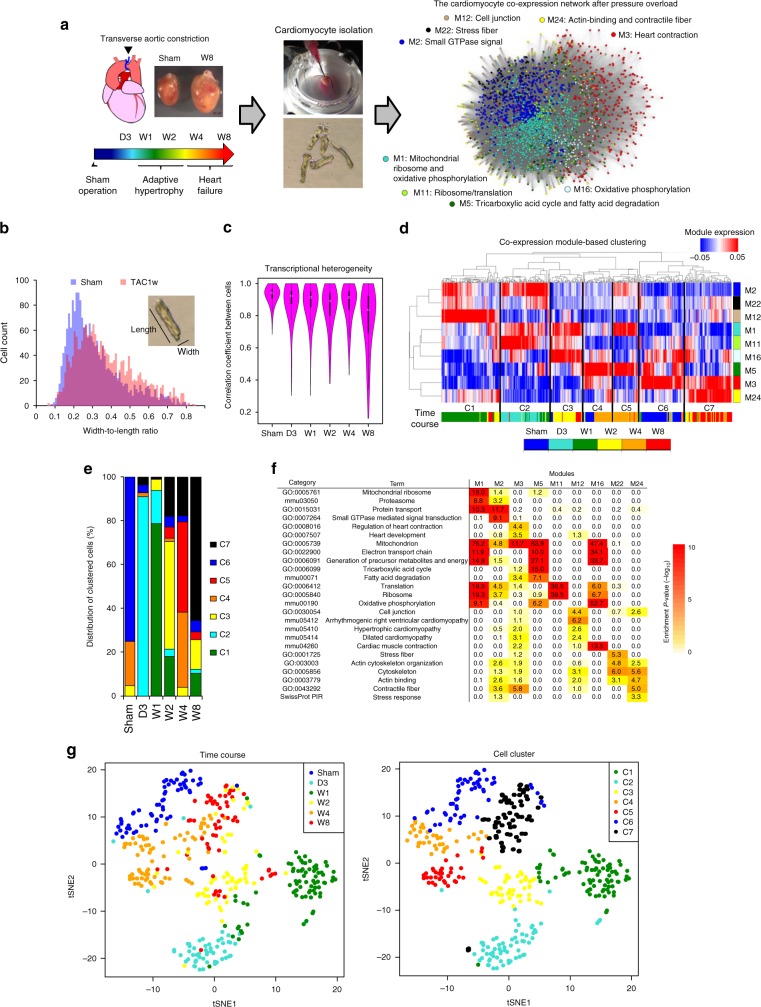
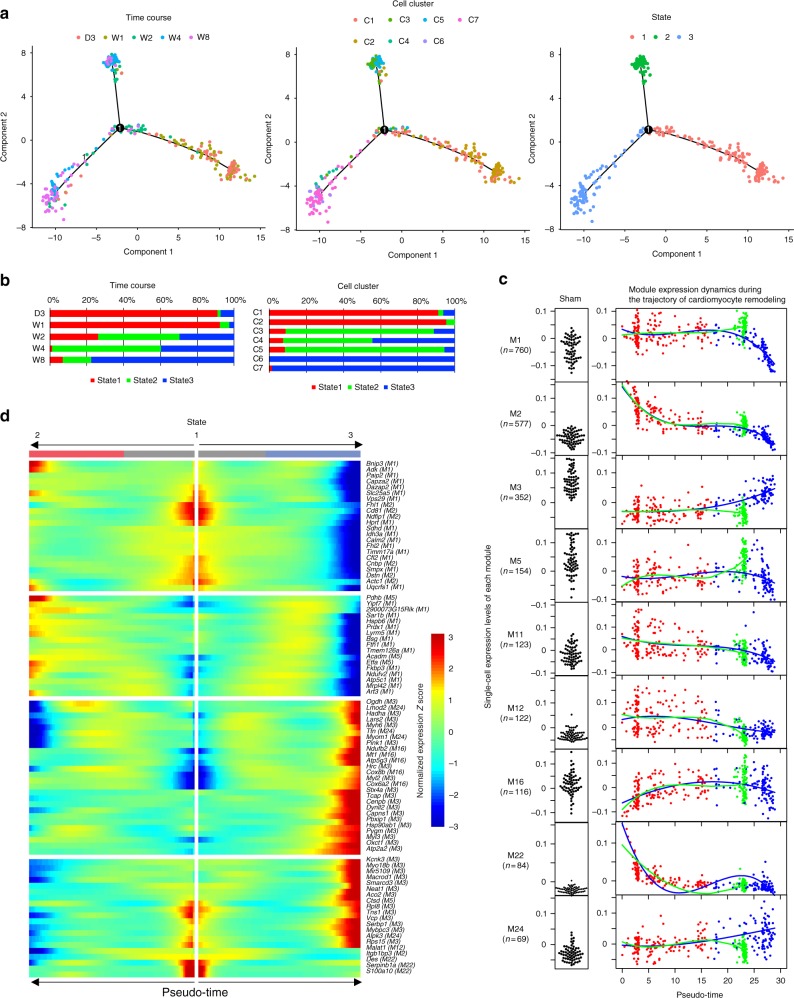
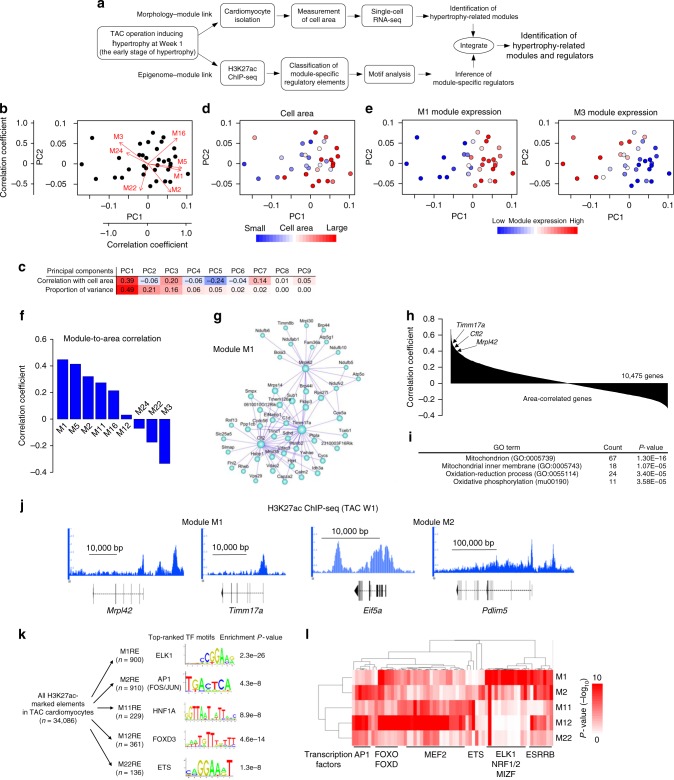
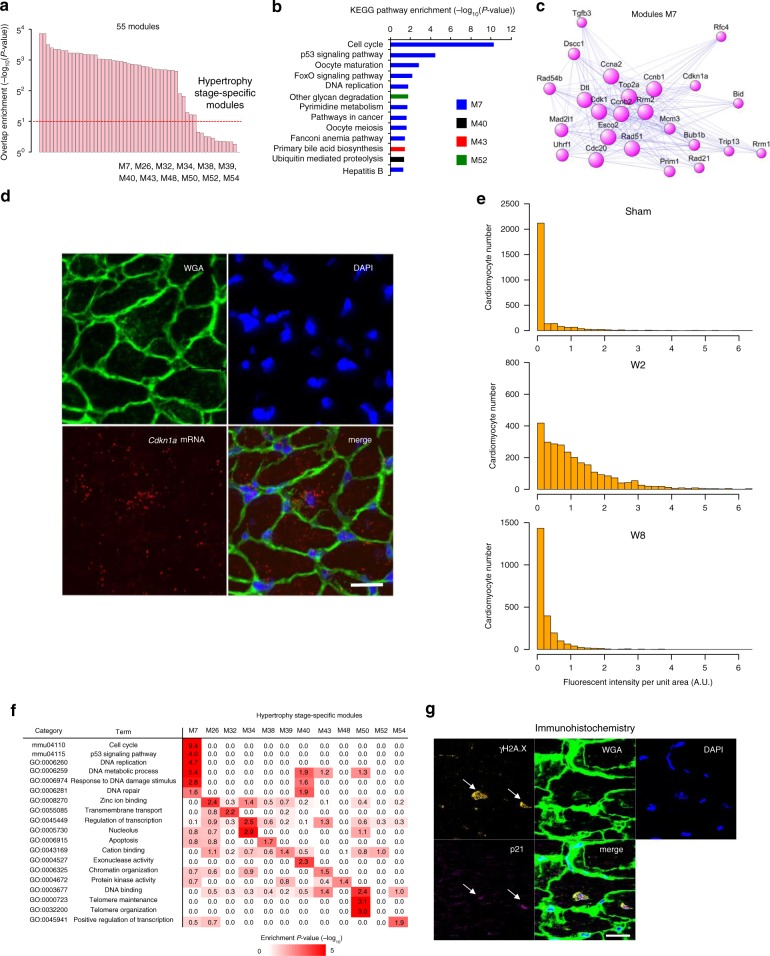
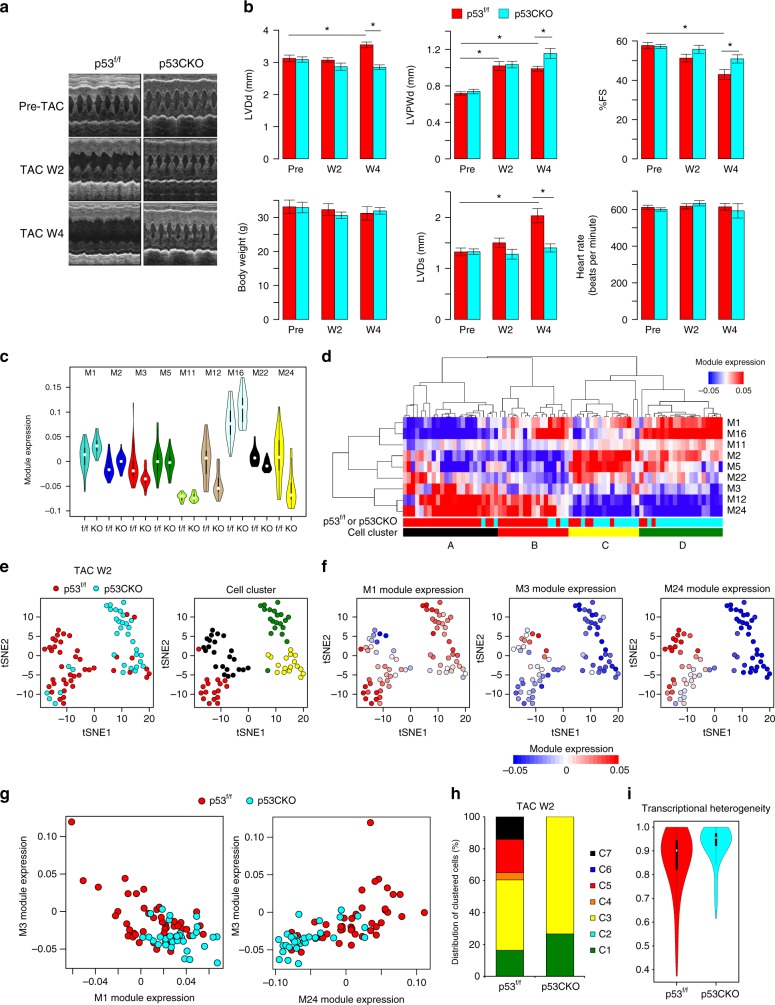
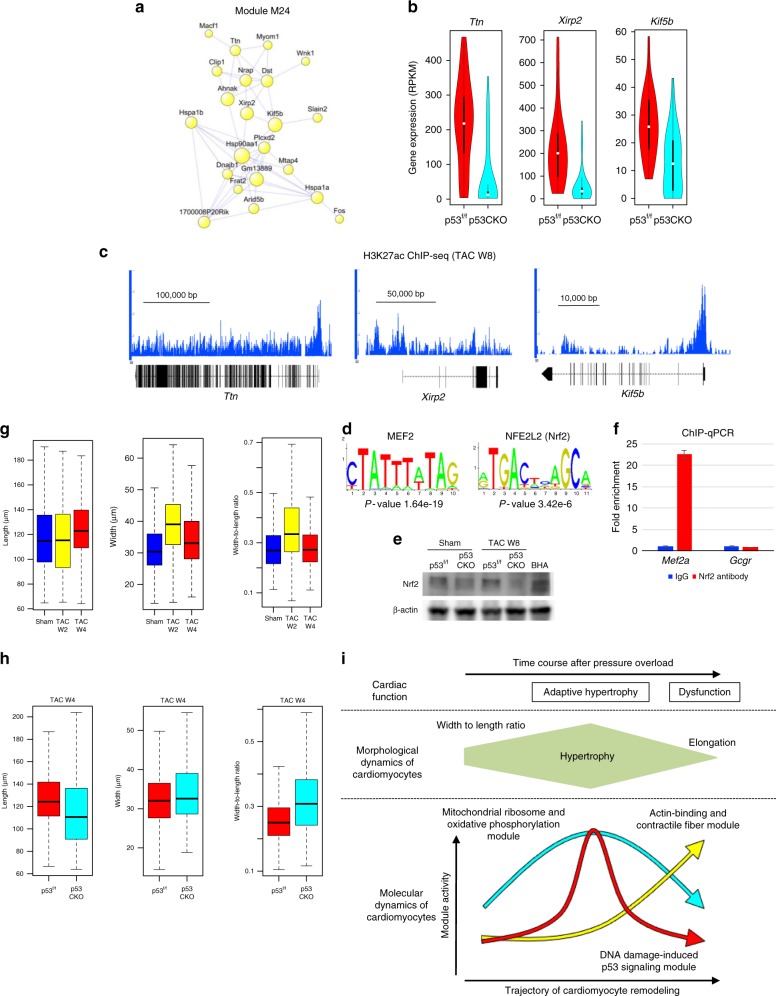
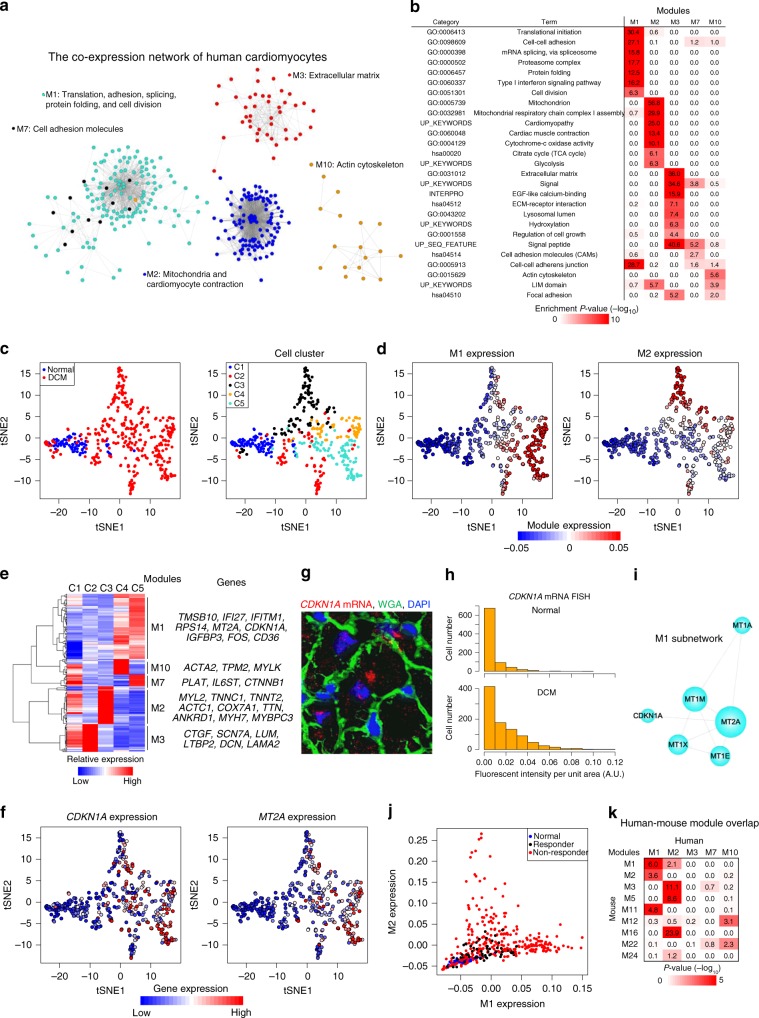
Pressure overload induces a transition from cardiac hypertrophy to heart failure, but its underlying mechanisms remain elusive. Here we reconstruct a trajectory of cardiomyocyte remodeling and clarify distinct cardiomyocyte gene programs encoding morphological and functional signatures in cardiac hypertrophy and failure, by integrating single-cardiomyocyte transcriptome with cell morphology, epigenomic state and heart function. During early hypertrophy, cardiomyocytes activate mitochondrial translation/metabolism genes, whose expression is correlated with cell size and linked to ERK1/2 and NRF1/2 transcriptional networks. Persistent overload leads to a bifurcation into adaptive and failing cardiomyocytes, and p53 signaling is specifically activated in late hypertrophy. Cardiomyocyte-specific p53 deletion shows that cardiomyocyte remodeling is initiated by p53-independent mitochondrial activation and morphological hypertrophy, followed by p53-dependent mitochondrial inhibition, morphological elongation, and heart failure gene program activation. Human single-cardiomyocyte analysis validates the conservation of the pathogenic transcriptional signatures. Collectively, cardiomyocyte identity is encoded in transcriptional programs that orchestrate morphological and functional phenotypes.


Conflict of interest statement

The authors declare no competing interests.

Figures

Fig. 1
Fig. 1
Co-expression network analysis of single-cardiomyocyte transcriptomes. a Experimental scheme to construct the co-expression network of single-cardiomyocyte transcriptomes from mice exposed to pressure overload. D3 day 3, W1 week 1, W2 week 2, W4 week 4, W8 week 8. In the network, nodes indicate genes and are positioned according to the weighted prefuse force-directed layout algorithm in Cytoscape. Edges indicate a significant correlation between genes. Length of the edges is relative to the expression similarity of the connected genes, with a short edge corresponding to a high co-expression value. Dot colors indicate module colors, matching the colors in d. b Bar plot showing the distribution of the width-to-length ratio of cells from mice after sham and transverse aorta constriction (TAC) operation (W1). c Violin plot showing the distribution of the correlation coefficients of single-cell transcriptomes among cells at each time point. d Unsupervised co-expression module-based clustering classifying all cardiomyocytes (n = 396) into seven cell clusters (C1–C7). The colored bar below the heatmap indicates the time when the cardiomyocytes were extracted; the colored bar on the right indicates module colors matching the node colors of the network in a. e Bar plot showing the distribution of clustered cells at each time point. f Heatmap showing the enrichment of gene ontology (GO) and Kyoto Encyclopedia of Genes and Genomes (KEGG) pathway terms in each module. g t-Distributed stochastic neighbor embedding (t-SNE) visualization of cardiomyocytes clustered in d. Cells (dots) are colored by the time when cardiomyocytes were extracted (left) and according to the cell clusters in d (right)
Fig. 2
Fig. 2
Single-cardiomyocyte trajectory analysis. a Single-cardiomyocyte trajectory after TAC operation reconstructed by Monocle. Cells are colored by the time when cardiomyocytes were extracted (left), according to the cell clusters (middle), and by the cell states annotated by Monocle (right). b Bar plot showing the distribution of the cell states (State 1, State 2, and State 3) at each time point (left) and in each cell cluster (right). c Module expression dynamics along the pseudo-time reconstructed by Monocle. Dot colors indicate state colors, matching the colors in b. Single-cell expression levels of each module in sham cardiomyocytes are represented as black dots (left). The fitted curves for the trajectory into State 2 (green) and State 3 (blue), and the number of genes assigned to the corresponding modules are also shown. d Heatmap showing the expression levels of differentially expressed genes during the trajectory. Corresponding modules are also denoted in parentheses
Fig. 3
Fig. 3
Hypertrophy-related modules and regulatory factors. a Experimental scheme to identify hypertrophy-related modules and regulators. b Principal component analysis (PCA) plot of cardiomyocytes from mice at 1 week after TAC in a. Arrows denote the correlation coefficients of the respective module with each principal component. c Correlation coefficient with cell area and proportion of variance for each principal component. d, e PCA plots colored by the cell area (d) and by the expression of each module (e). f Bar plot showing the correlation coefficient between cell area and module expression. Modules are ordered by the correlation levels. g Hub gene network of M1. The size of the dots represents node centrality. h Bar plot showing the correlation coefficient between cell area and gene expression. Genes whose expression was detected in at least one of the samples are ordered by correlation levels. i List of the most enriched GO terms in the top 300 correlated genes with cell area. j Representative genome browser views of H3K27ac ChIP-seq of cardiomyocytes from mice at 1 week after TAC. The Y-axis indicates reads per million (range, 0–3). k Transcription factor recognition motifs most significantly enriched in the regulatory elements (REs) for each module. l Hierarchical clustering of transcription factor recognition motifs. The top 10 significantly enriched motifs for each module are selected. Transcription factors strongly expressed in cardiomyocytes are shown below the heatmap
Fig. 4
Fig. 4
Hypertrophy-stage-specific p53 signaling activation. a Bar plot showing the statistical significance of the overlap between modules detected from co-expression analysis with or without hypertrophy-stage cardiomyocytes. The most strongly overlapping module pairs are selected from Supplementary Fig. 13a. Modules are ordered by significance level. The red line indicates the threshold for hypertrophy stage-specific modules. b KEGG pathway enrichment of 12 hypertrophy stage-specific modules identified in a and Supplementary Fig. 13a. c Co-expression network analysis of M7. d Representative images of Cdkn1a mRNA smFISH in the heart from mice at 2 weeks after pressure overload. Wheat germ agglutinin (WGA) and DAPI are used as markers of the plasma membrane and nucleus, respectively. Scale bar, 20 μm. e Bar plots showing the distribution of cells corresponding to the single-cell fluorescent intensity of Cdkn1a mRNA detected by smFISH in the heart after sham and TAC (weeks 2 and 8) operation. f Heatmap showing the enrichment of GO and KEGG pathway terms in 12 hypertrophy stage-specific modules. g Immunohistochemical staining of gH2A.X and p21 in the heart of mice at 2 weeks after pressure overload. WGA and DAPI are used as markers of the plasma membrane and nucleus, respectively. Arrows indicate the nuclei of gH2A.X and p21 double-positive cardiomyocytes. Scale bar, 20 μm
Fig. 5
Fig. 5
p53 is necessary for the emergence of failing cardiomyocytes and the development of heart failure. a Representative images of an echocardiographic assessment of p53flox/flox (p53f/f) and p53CKO mice before and after TAC (weeks 2 and 4). b Bar plots showing body weight, cardiac size, and cardiac function evaluated by echocardiography in p53f/f and p53CKO mice before and after pressure overload. Mean and standard error of the mean are shown (n = 12 [p53f/f] and 15 [p53CKO] for pre-TAC, 11 [p53f/f] and 10 [p53CKO] for post-TAC W2, and 7 [p53f/f] and 7 [p53CKO] for post-TAC W4). Asterisks indicate statistical significance (P < 0.05, two-tailed unpaired t-test). c Violin plot showing the distribution of the correlation coefficients of single-cell transcriptomes among cardiomyocytes from p53f/f and p53CKO mice at 2 weeks after TAC (43 p53flox/flox and 34 p53CKO cardiomyocytes). d Unsupervised hierarchical clustering classifying cardiomyocytes (p53f/f and p53CKO cardiomyocytes [TAC W2]) into four cell clusters (cell clusters A–D). Colored bars below the heatmap indicate the cell sources (p53f/f [red] or p53CKO [cyan]) and the cell clusters (A–D). e t-SNE plots of cardiomyocytes from p53f/f and p53CKO mice at 2 weeks after TAC. Cells (dots) are colored by the cell sources (left) and according to the cell clusters in d (right). f t-SNE plots colored by the expression of each module. g Scatter plots showing the expression of M1 and M3 (left) and M3 and M24 (right) in cardiomyocytes from p53f/f and p53CKO mice. h Bar plot showing the distribution of allocated cardiomyocytes from p53f/f and p53CKO mice (TAC W2). i Violin plot showing the distribution of the correlation coefficients of single-cell transcriptomes among cardiomyocytes from p53f/f and p53CKO mice (TAC W2)
Fig. 6
Fig. 6
p53 induces molecular and morphological remodeling leading to heart failure. a Co-expression network analysis of M24. b Violin plots showing the expression of Ttn, Xirp2, and Kif5b in cardiomyocytes from p53f/f and p53CKO mice at 2 weeks after TAC (43 p53flox/flox and 34 p53CKO cardiomyocytes). c Representative genome browser views of H3K27ac ChIP-seq of cardiomyocytes at 8 weeks after TAC. The Y-axis indicates reads per million (range, 0–4). d The enriched transcription factor recognition motifs at the H3K27ac-positive regions (TAC W8 cardiomyocytes) around the M24 genes. e Western blot analysis of heart tissues using antibodies against Nrf2 and β-actin. Butylated hydroxyanisole (BHA), an oxidative stress inducer, was used as a positive control. Uncropped images of the blots are shown in Supplementary Fig. 14d. f ChIP-qPCR analysis of cardiomyocytes from mice at 8 weeks after TAC operation. Data are represented as mean and standard error of the mean (n = 3 each). The Gcgr locus was used as a control region. g Boxplots showing the distribution of the morphological parameters of cardiomyocytes from mice after sham and TAC operation (n = 1243 [Sham], 1366 [TAC W2], 717 [TAC W4] from three mice each). Horizontal lines indicate the medians. Boxes show the 25th–75th percentiles. Whiskers represent the minimum and maximum values. h Boxplots showing the distribution of morphological parameters of cardiomyocytes from p53f/f and p53CKO mice at 4 weeks after TAC (n= 1761 [p53f/f], 1538 [p53CKO] from three mice each). Horizontal lines indicate the medians. Boxes show the 25th–75th percentiles. Whiskers represent the minimum and maximum values. i Model for the coordinated molecular and morphological dynamics of cardiomyocytes leading to heart failure
Fig. 7
Fig. 7
Distinct gene programs and their pathogenicity in human cardiomyocytes. a Co-expression network of human cardiomyocytes. Dot colors indicate module colors, matching the colors in b. b Heatmap showing the enrichment of GO and KEGG pathway terms in each module. c t-SNE visualization of human cardiomyocytes (71 normal and 340 dilated cardiomyopathy (DCM) cardiomyocytes). Cells (dots) are colored according to the cell clusters in Supplementary Fig. 16b. d t-SNE plots of human cardiomyocytes colored by the expression of each module. e Heatmap showing the relative average expression for characteristic genes across the five modules. Representative genes are also indicated. f t-SNE plots of human cardiomyocytes colored by the expression of each gene. g Representative images of CDKN1A mRNA smFISH of the DCM heart. WGA and DAPI are used as markers of the plasma membrane and nucleus, respectively. Scale bar, 20 μm. h Bar plots showing the distribution of cells corresponding to the single-cell fluorescent intensity of CDKN1A mRNA detected by smFISH in the normal and DCM hearts. i Subnetwork analysis of human M1. j Scatter plot showing the relationship between M1 and M2 expression. DCM cardiomyocytes are separated into two groups: responder (n = 59) and non-responder (n = 281). k Heatmap showing the significance of gene overlaps between human and mouse modules. The table is colored by −log10(P-value), obtained with Fisher’s exact test, according to the color legend below the table

Similar articles

Cited by

References

    1. Komuro I, Yazaki Y. Control of cardiac gene expression by mechanical stress. Annu. Rev. Physiol. 1993;55:55–75. doi: 10.1146/annurev.ph.55.030193.000415. - DOI - PubMed
    1. Mann DL, Felker GM. Heart Failure: A Companion to Braunwald’s Heart Disease. 3rd edn. Amsterdam: Elsevier; 2016.
    1. Frey N, Olson EN. Cardiac hypertrophy: the good, the bad, and the ugly. Annu. Rev. Physiol. 2003;65:45–79. doi: 10.1146/annurev.physiol.65.092101.142243. - DOI - PubMed
    1. Mudd JO, Kass DA. Tackling heart failure in the twenty-first century. Nature. 2008;451:919–928. doi: 10.1038/nature06798. - DOI - PubMed
    1. MacLellan WR, Schneider MD. Genetic dissection of cardiac growth control pathways. Annu. Rev. Physiol. 2000;62:289–319. doi: 10.1146/annurev.physiol.62.1.289. - DOI - PubMed

Publication types

Substances