Statistical inference of the rate of RNA polymerase II elongation by total RNA sequencing
- PMID: 30376061
- PMCID: PMC6546130
- DOI: 10.1093/bioinformatics/bty886
Statistical inference of the rate of RNA polymerase II elongation by total RNA sequencing
Abstract
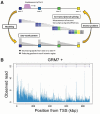
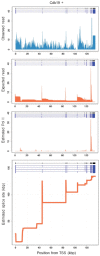
Motivation: Sequencing total RNA without poly-A selection enables us to obtain a transcriptomic profile of nascent RNAs undergoing transcription with co-transcriptional splicing. In general, the RNA-seq reads exhibit a sawtooth pattern in a gene, which is characterized by a monotonically decreasing gradient across introns in the 5'-3' direction, and by substantially higher levels of RNA-seq reads present in exonic regions. Such patterns result from the process of underlying transcription elongation by RNA polymerase II, which traverses the DNA strand in a 5'-3' direction as it performs a complex series of mRNA synthesis and processing. Therefore, data of sequenced total RNAs could be utilized to infer the rate of transcription elongation by solving the inverse problem.
Results: Though solving the inverse problem in total RNA-seq has the great potential, statistical methods have not yet been fully developed. We demonstrate what extent the newly developed method can be useful. The objective is to reconstruct the spatial distribution of transcription elongation rates in a gene from a given noisy, sawtooth-like profile. It is necessary to recover the signal source of the elongation rates separately from several types of nuisance factors, such as unobserved modes of co-transcriptionally occurring mRNA splicing, which exert significant influences on the sawtooth shape. The present method was tested using published total RNA-seq data derived from mouse embryonic stem cells. We investigated the spatial characteristics of the estimated elongation rates, focusing especially on the relation to promoter-proximal pausing of RNA polymerase II, nucleosome occupancy and histone modification patterns.
Availability and implementation: A C implementation of PolSter and sample data are available at https://github.com/yoshida-lab/PolSter.
Supplementary information: Supplementary data are available at Bioinformatics online.
© The Author(s) 2018. Published by Oxford University Press.
Figures


Similar articles
-
Quantification of co-transcriptional splicing from RNA-Seq data.Methods. 2015 Sep 1;85:36-43. doi: 10.1016/j.ymeth.2015.04.024. Epub 2015 Apr 27. Methods. 2015. PMID: 25929182
-
Pause locally, splice globally.Trends Cell Biol. 2011 Jun;21(6):328-35. doi: 10.1016/j.tcb.2011.03.002. Epub 2011 Apr 27. Trends Cell Biol. 2011. PMID: 21530266 Review.
-
PennDiff: detecting differential alternative splicing and transcription by RNA sequencing.Bioinformatics. 2018 Jul 15;34(14):2384-2391. doi: 10.1093/bioinformatics/bty097. Bioinformatics. 2018. PMID: 29474557 Free PMC article.
-
The temporal landscape of recursive splicing during Pol II transcription elongation in human cells.PLoS Genet. 2018 Aug 27;14(8):e1007579. doi: 10.1371/journal.pgen.1007579. eCollection 2018 Aug. PLoS Genet. 2018. PMID: 30148885 Free PMC article.
-
P-TEFb stimulates transcription elongation and pre-mRNA splicing through multilateral mechanisms.RNA Biol. 2010 Mar-Apr;7(2):145-50. doi: 10.4161/rna.7.2.11057. Epub 2010 Mar 29. RNA Biol. 2010. PMID: 20305375 Review.
Cited by
-
RNA polymerase II speed: a key player in controlling and adapting transcriptome composition.EMBO J. 2021 Aug 2;40(15):e105740. doi: 10.15252/embj.2020105740. Epub 2021 Jul 13. EMBO J. 2021. PMID: 34254686 Free PMC article. Review.
-
Global impact of aberrant splicing on human gene expression levels.bioRxiv [Preprint]. 2023 Oct 16:2023.09.13.557588. doi: 10.1101/2023.09.13.557588. bioRxiv. 2023. Update in: Nat Genet. 2024 Sep;56(9):1851-1861. doi: 10.1038/s41588-024-01872-x. PMID: 37745605 Free PMC article. Updated. Preprint.
-
Geometrically encoded positioning of introns, intergenic segments, and exons in the human genome.bioRxiv [Preprint]. 2025 May 29:2025.05.29.656862. doi: 10.1101/2025.05.29.656862. bioRxiv. 2025. PMID: 40501616 Free PMC article. Preprint.
-
RNA Polymerase II Activity Control of Gene Expression and Involvement in Disease.J Mol Biol. 2025 Jan 1;437(1):168770. doi: 10.1016/j.jmb.2024.168770. Epub 2024 Aug 28. J Mol Biol. 2025. PMID: 39214283 Free PMC article. Review.
References
-
- Ameur A., et al. (2011) Total RNA sequencing reveals nascent transcription and widespread co-transcriptional splicing in the human brain. Nat. Struct. Mol. Biol., 18, 1435–1440. - PubMed
-
- Bolić M., et al. (2004) Resampling algorithms for particle filters: a computational complexity perspective. EURASIP J. Appl. Signal Process., 15, 2267–2277.
Publication types
MeSH terms
Substances
LinkOut - more resources
Full Text Sources
Miscellaneous

