

Standardized protocols and procedures can precisely and accurately quantify non-structural carbohydrates
- PMID: 30376128
- PMCID: PMC6301340
- DOI: 10.1093/treephys/tpy118
Standardized protocols and procedures can precisely and accurately quantify non-structural carbohydrates
Abstract
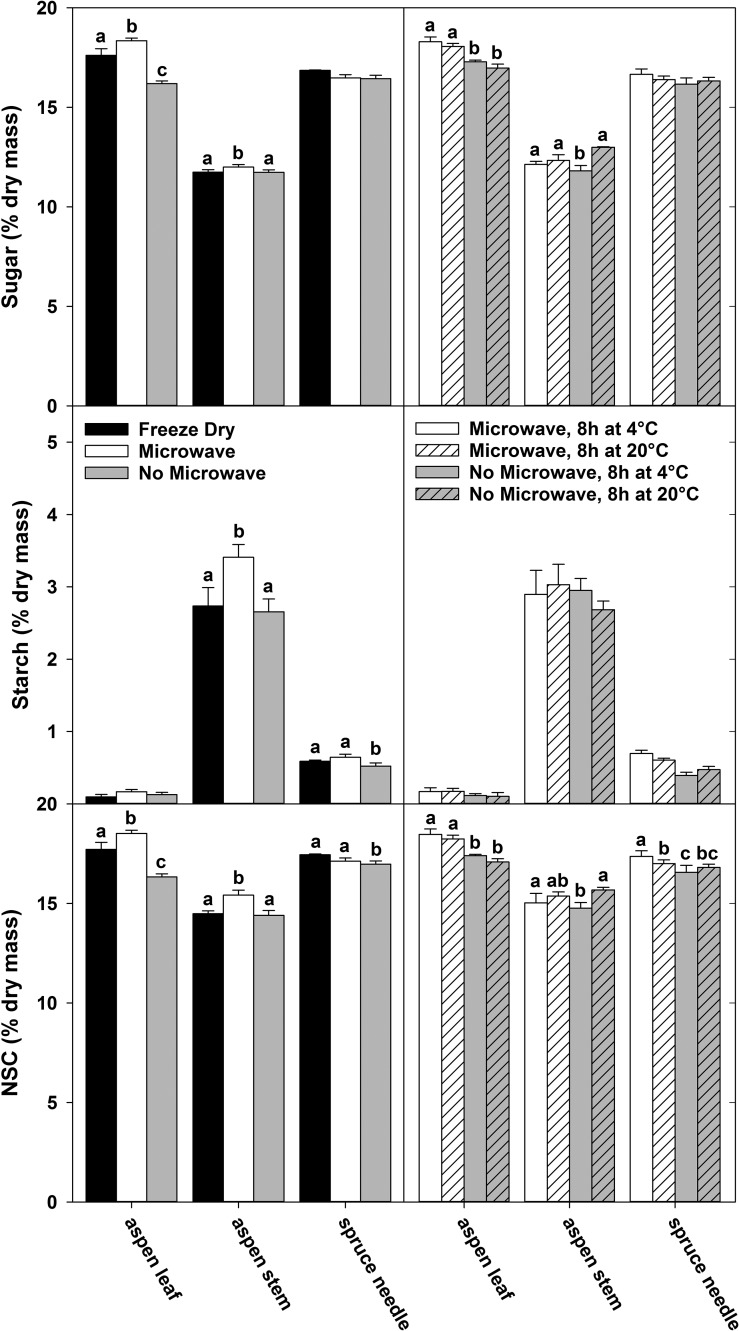
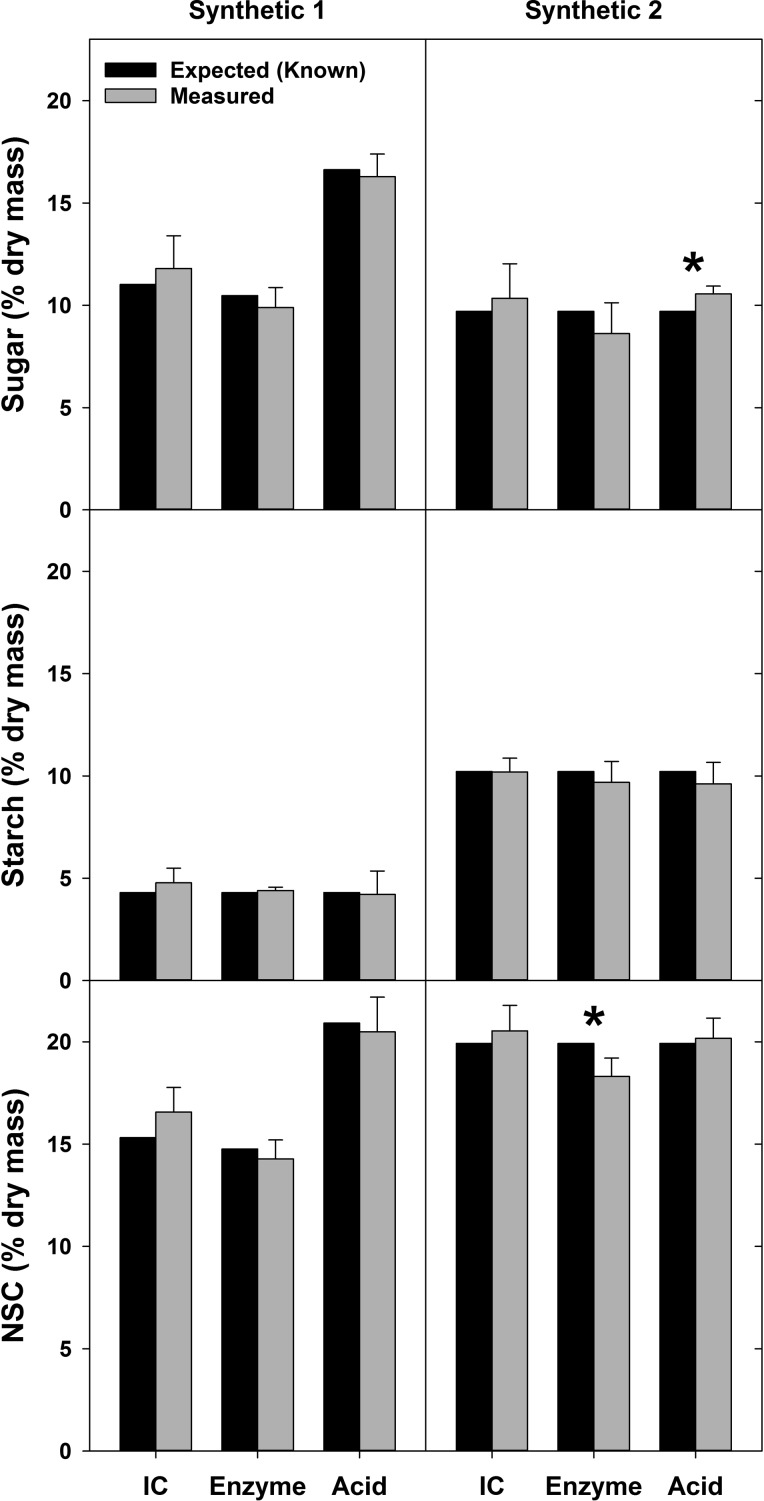
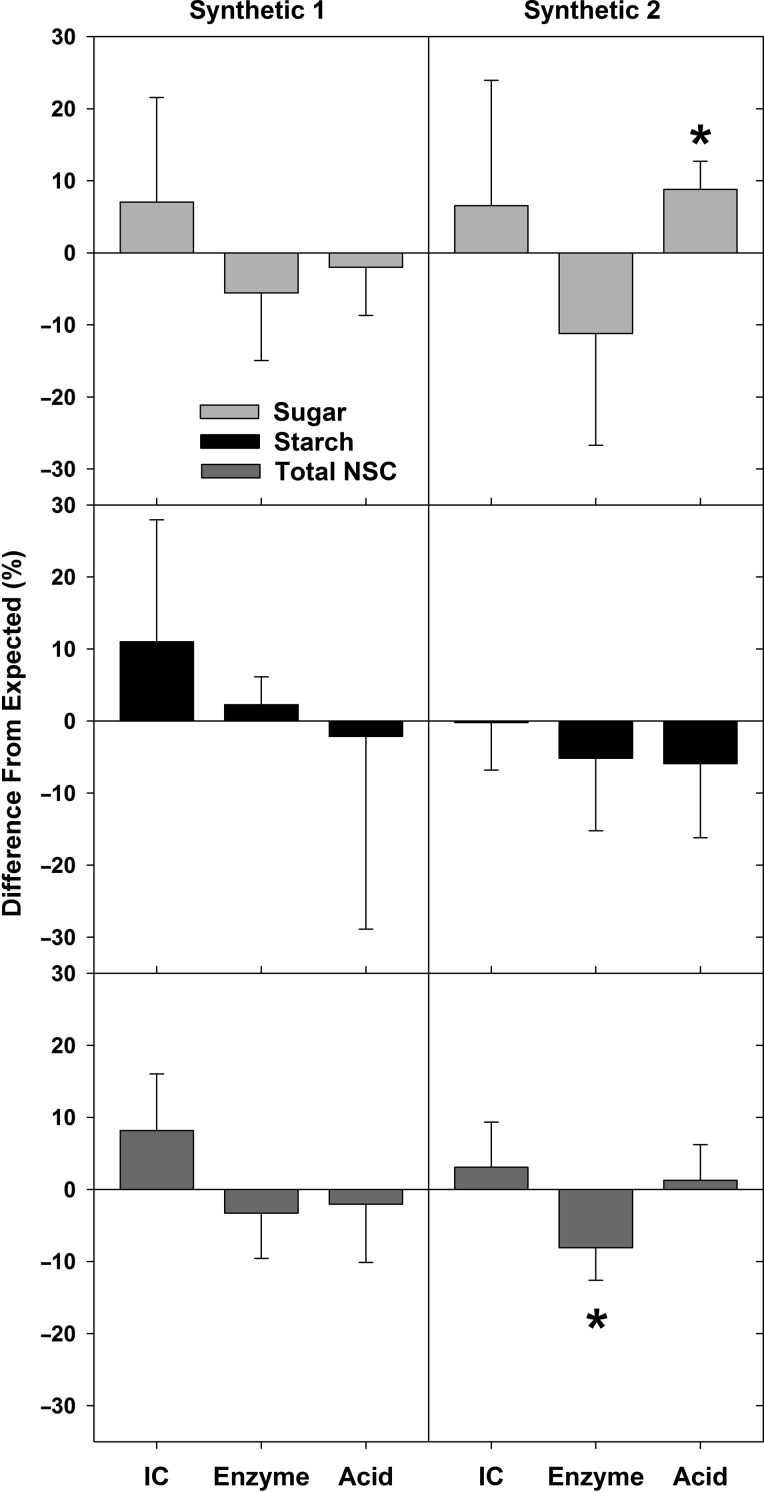
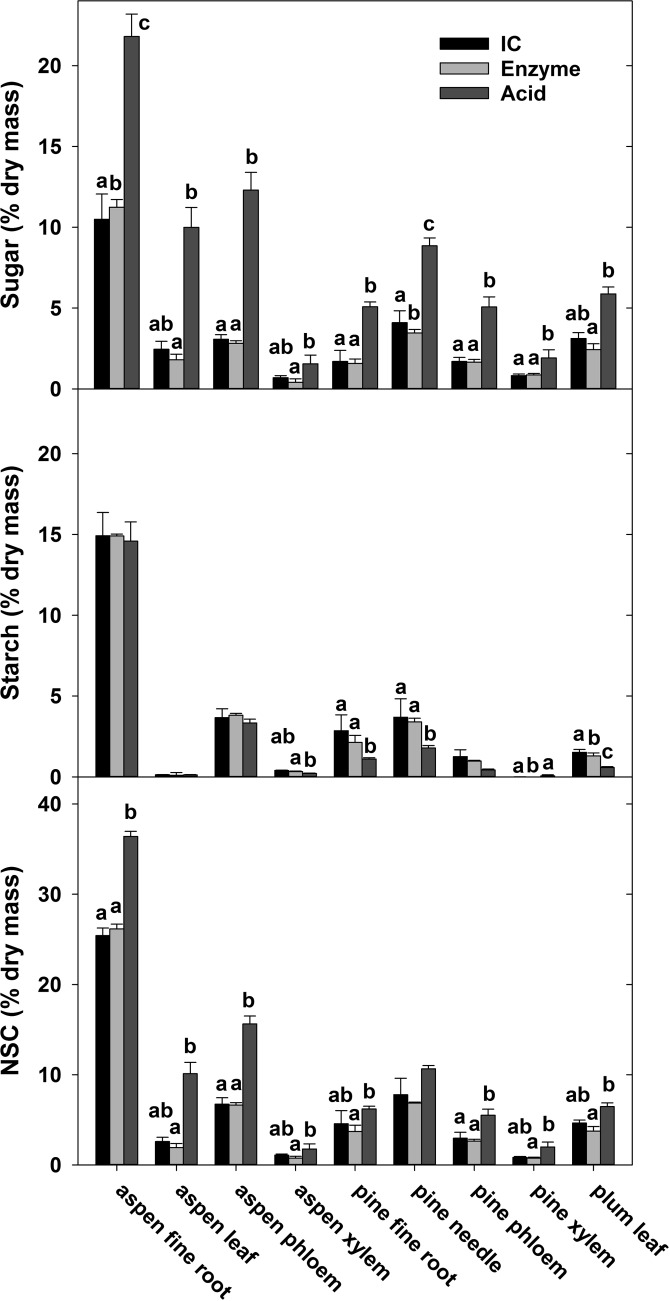
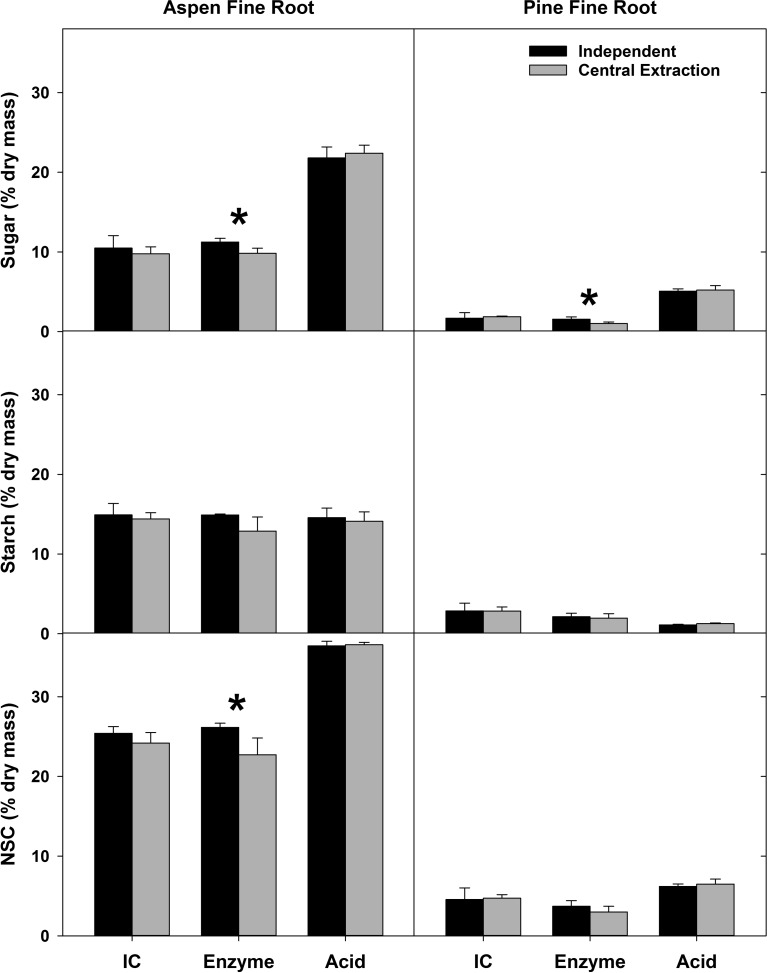
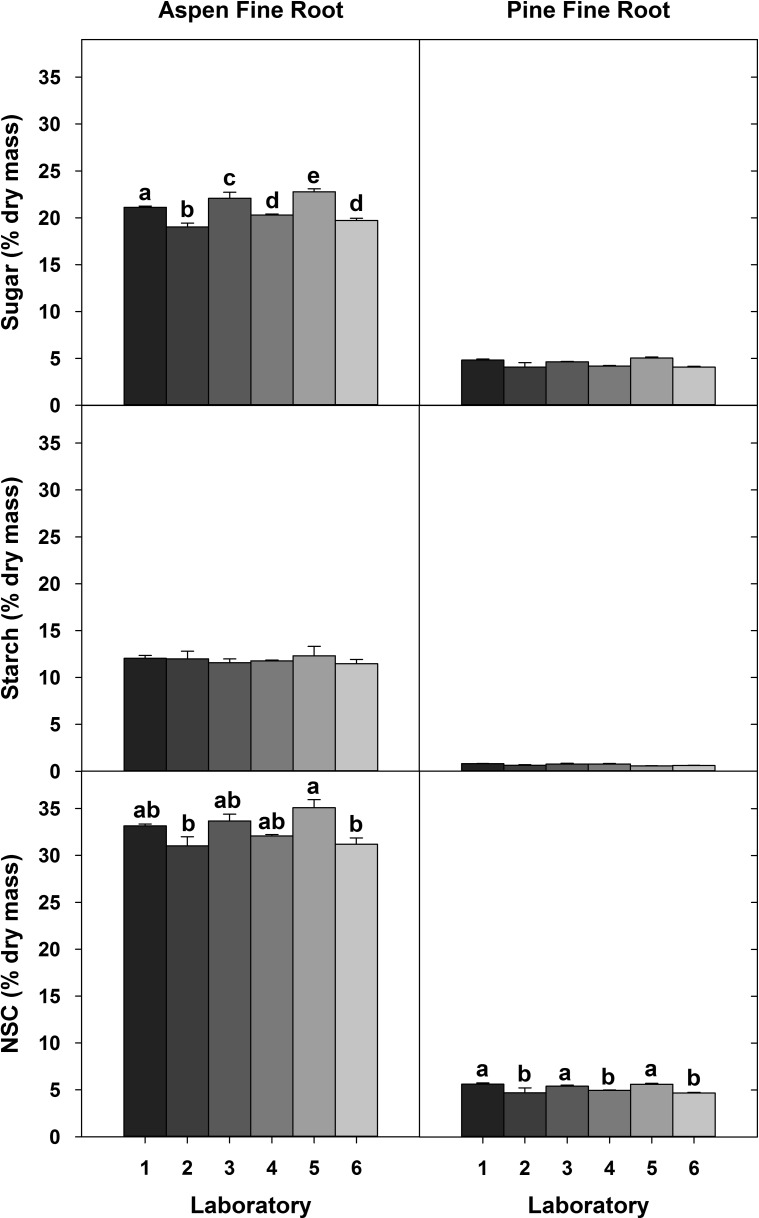
Non-structural carbohydrates (NSCs), the stored products of photosynthesis, building blocks for growth and fuel for respiration, are central to plant metabolism, but their measurement is challenging. Differences in methods and procedures among laboratories can cause results to vary widely, limiting our ability to integrate and generalize patterns in plant carbon balance among studies. A recent assessment found that NSC concentrations measured for a common set of samples can vary by an order of magnitude, but sources for this variability were unclear. We measured a common set of nine plant material types, and two synthetic samples with known NSC concentrations, using a common protocol for sugar extraction and starch digestion, and three different sugar quantification methods (ion chromatography, enzyme, acid) in six laboratories. We also tested how sample handling, extraction solvent and centralizing parts of the procedure in one laboratory affected results. Non-structural carbohydrate concentrations measured for synthetic samples were within about 11.5% of known values for all three methods. However, differences among quantification methods were the largest source of variation in NSC measurements for natural plant samples because the three methods quantify different NSCs. The enzyme method quantified only glucose, fructose and sucrose, with ion chromatography we additionally quantified galactose, while the acid method quantified a large range of mono- and oligosaccharides. For some natural samples, sugars quantified with the acid method were two to five times higher than with other methods, demonstrating that trees allocate carbon to a range of sugar molecules. Sample handling had little effect on measurements, while ethanol sugar extraction improved accuracy over water extraction. Our results demonstrate that reasonable accuracy of NSC measurements can be achieved when different methods are used, as long as protocols are robust and standardized. Thus, we provide detailed protocols for the extraction, digestion and quantification of NSCs in plant samples, which should improve the comparability of NSC measurements among laboratories.
Figures
Comment in
-
Doing the best we can: the realities of measuring non-structural carbohydrates in trees.Tree Physiol. 2018 Dec 1;38(12):1761-1763. doi: 10.1093/treephys/tpy138. Tree Physiol. 2018. PMID: 30551168 No abstract available.
Similar articles
-
Non-structural carbohydrates in woody plants compared among laboratories.Tree Physiol. 2015 Nov;35(11):1146-65. doi: 10.1093/treephys/tpv073. Epub 2015 Sep 29. Tree Physiol. 2015. PMID: 26423132
-
The mechanisms and prediction of non-structural carbohydrates accretion and depletion after mechanical wounding in slash pine (Pinus elliottii) using near-infrared reflectance spectroscopy.Plant Methods. 2022 Sep 1;18(1):107. doi: 10.1186/s13007-022-00939-2. Plant Methods. 2022. PMID: 36050789 Free PMC article.
-
Soluble Sugar and Starch Extraction and Quantification from Maize (Zea mays) Leaves.Curr Protoc Plant Biol. 2016 May;1(1):139-161. doi: 10.1002/cppb.20018. Curr Protoc Plant Biol. 2016. PMID: 31725991
-
Understanding the roles of nonstructural carbohydrates in forest trees - from what we can measure to what we want to know.New Phytol. 2016 Jul;211(2):386-403. doi: 10.1111/nph.13955. Epub 2016 Apr 7. New Phytol. 2016. PMID: 27061438 Review.
-
Challenges with nonfiber carbohydrate methods.J Anim Sci. 2003 Dec;81(12):3226-32. doi: 10.2527/2003.81123226x. J Anim Sci. 2003. PMID: 14677880 Review.
Cited by
-
Evaluation of carbon balance and carbohydrate reserves from forced (Vitis vinifera L.) cv. Tempranillo vines.Front Plant Sci. 2022 Nov 22;13:998910. doi: 10.3389/fpls.2022.998910. eCollection 2022. Front Plant Sci. 2022. PMID: 36483969 Free PMC article.
-
Hotter droughts alter resource allocation to chemical defenses in piñon pine.Oecologia. 2021 Dec;197(4):921-938. doi: 10.1007/s00442-021-05058-8. Epub 2021 Oct 17. Oecologia. 2021. PMID: 34657177 Free PMC article.
-
Enzymatic Treatment of Spent Green Tea Leaves and Their Use in High-Fibre Cookie Production.Food Technol Biotechnol. 2022 Sep;60(3):396-405. doi: 10.17113/ftb.60.03.22.7474. Food Technol Biotechnol. 2022. PMID: 36320349 Free PMC article.
-
The Possible Role of Non-Structural Carbohydrates in the Regulation of Tree Hydraulics.Int J Mol Sci. 2019 Dec 24;21(1):144. doi: 10.3390/ijms21010144. Int J Mol Sci. 2019. PMID: 31878253 Free PMC article. Review.
-
Gas exchange, biomass and non-structural carbohydrates dynamics in vines under combined drought and biotic stress.BMC Plant Biol. 2019 Sep 18;19(1):408. doi: 10.1186/s12870-019-2017-2. BMC Plant Biol. 2019. PMID: 31533621 Free PMC article.
References
-
- Adams HD, Germino MJ, Breshears DD, Barron-Gafford GA, Guardiola-Claramonte M, Zou CB, Huxman TE (2013) Nonstructural leaf carbohydrate dynamics of Pinus edulis during drought-induced tree mortality reveal role for carbon metabolism in mortality mechanism. New Phytol 197:1142–1151. - PubMed
-
- Adams HD, Zeppel MJB, Anderegg WRL et al. . (2017) A multi-species synthesis of physiological mechanisms in drought-induced tree mortality. Nat Ecol Evol 1:1285–1291. - PubMed
-
- Asner GP, Martin RE (2016) Convergent elevation trends in canopy chemical traits of tropical forests. Glob Chang Biol 22:2216–2227. - PubMed
-
- Aubin I, Munson AD, Cardou F et al. . (2016) Traits to stay, traits to move: a review of functional traits to assess sensitivity and adaptive capacity of temperate and boreal trees to climate change. Environ Rev 24:164–186.
Publication types
MeSH terms
Substances
LinkOut - more resources
Full Text Sources
Other Literature Sources
