

Regional subcortical shape analysis in premanifest Huntington's disease
- PMID: 30376191
- PMCID: PMC6420821
- DOI: 10.1002/hbm.24456
Regional subcortical shape analysis in premanifest Huntington's disease
Abstract
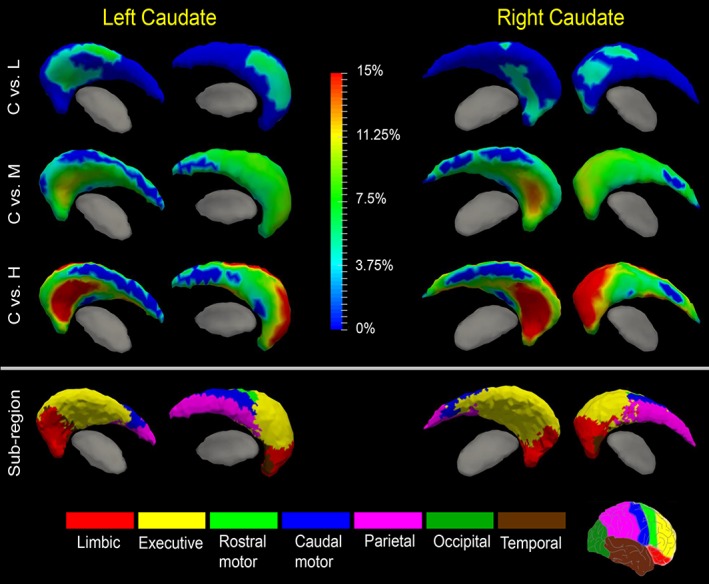
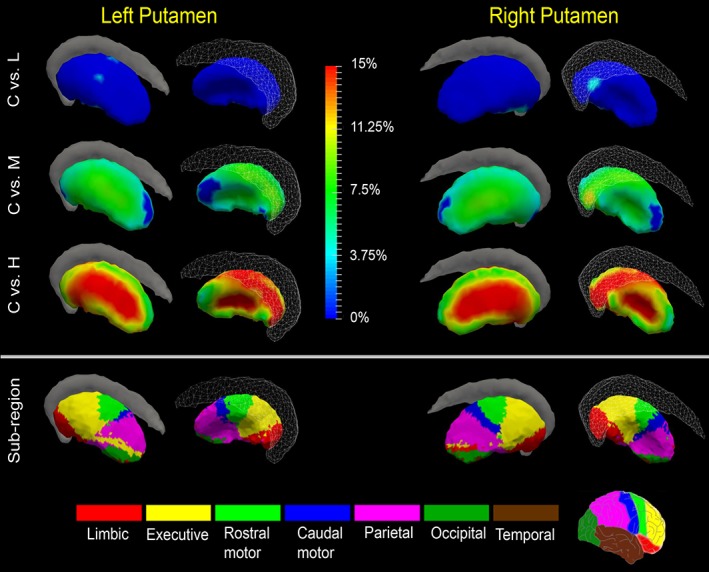
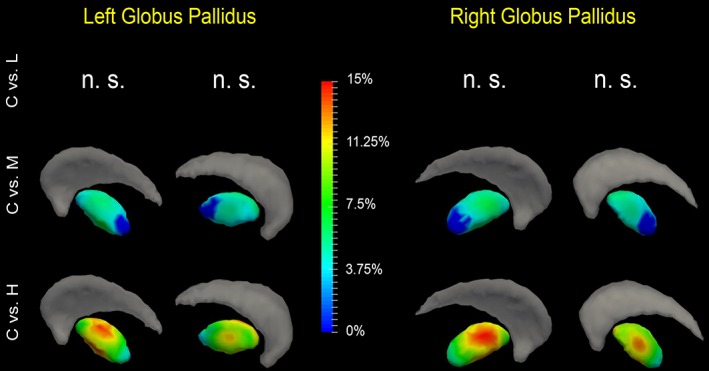
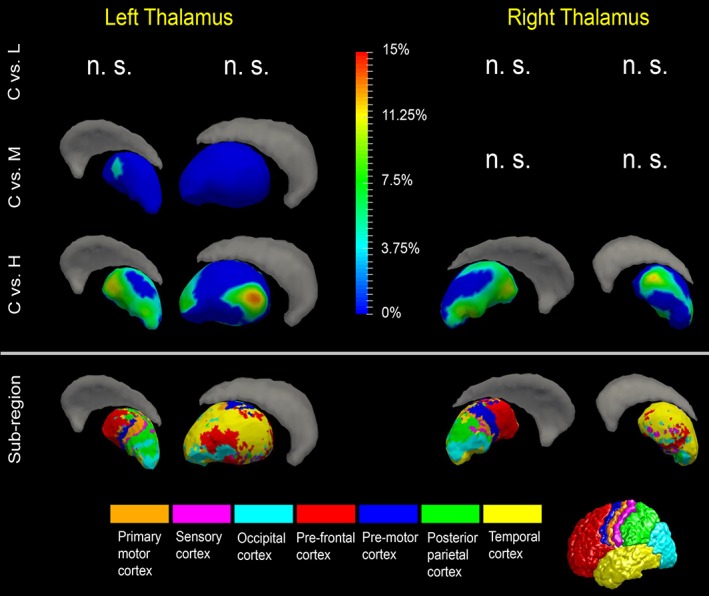
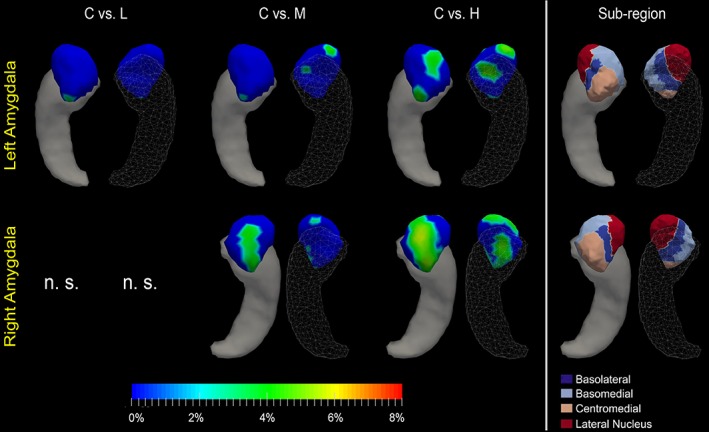
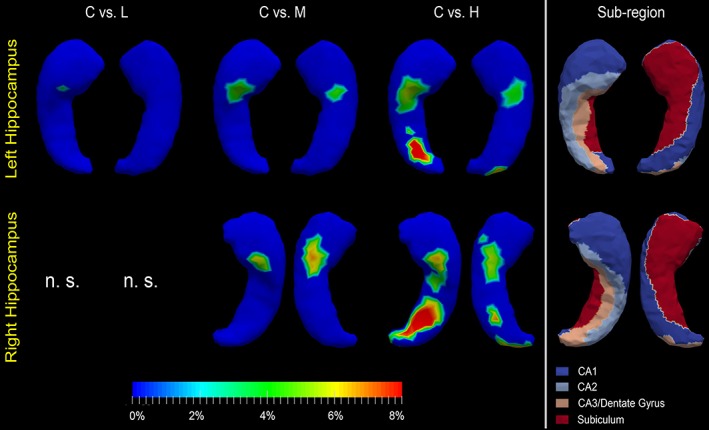
Huntington's disease (HD) involves preferential and progressive degeneration of striatum and other subcortical regions as well as regional cortical atrophy. It is caused by a CAG repeat expansion in the Huntingtin gene, and the longer the expansion the earlier the age of onset. Atrophy begins prior to manifest clinical signs and symptoms, and brain atrophy in premanifest expansion carriers can be studied. We employed a diffeomorphometric pipeline to contrast subcortical structures' morphological properties in a control group with three disease groups representing different phases of premanifest HD (far, intermediate, and near to onset) as defined by the length of the CAG expansion and the participant's age (CAG-Age-Product). A total of 1,428 magnetic resonance image scans from 694 participants from the PREDICT-HD cohort were used. We found significant region-specific atrophies in all subcortical structures studied, with the estimated abnormality onset time varying from structure to structure. Heterogeneous shape abnormalities of caudate nuclei were present in premanifest HD participants estimated furthest from onset and putaminal shape abnormalities were present in participants intermediate to onset. Thalamic, hippocampal, and amygdalar shape abnormalities were present in participants nearest to onset. We assessed whether the estimated progression of subcortical pathology in premanifest HD tracked specific pathways. This is plausible for changes in basal ganglia circuits but probably not for changes in hippocampus and amygdala. The regional shape analyses conducted in this study provide useful insights into the effects of HD pathology in subcortical structures.
Keywords: circuit; premanifest Huntington's disease; shape; subcortical structures; subregion.
© 2018 Wiley Periodicals, Inc.
Figures
Similar articles
-
Shape analysis of subcortical nuclei in Huntington's disease, global versus local atrophy--results from the TRACK-HD study.J Neurol Sci. 2011 Aug 15;307(1-2):60-8. doi: 10.1016/j.jns.2011.05.015. Epub 2011 May 31. J Neurol Sci. 2011. PMID: 21624624 Clinical Trial.
-
Elevated brain iron is independent from atrophy in Huntington's Disease.Neuroimage. 2012 Jul 2;61(3):558-64. doi: 10.1016/j.neuroimage.2012.03.056. Epub 2012 Mar 28. Neuroimage. 2012. PMID: 22480728
-
Relationship between CAG repeat length and brain volume in premanifest and early Huntington's disease.J Neurol. 2009 Feb;256(2):203-12. doi: 10.1007/s00415-009-0052-x. Epub 2009 Mar 5. J Neurol. 2009. PMID: 19266143
-
Structural Magnetic Resonance Imaging in Huntington's Disease.Int Rev Neurobiol. 2018;142:335-380. doi: 10.1016/bs.irn.2018.09.006. Epub 2018 Oct 8. Int Rev Neurobiol. 2018. PMID: 30409258 Review.
-
Molecular Imaging Markers to Track Huntington's Disease Pathology.Front Neurol. 2017 Jan 30;8:11. doi: 10.3389/fneur.2017.00011. eCollection 2017. Front Neurol. 2017. PMID: 28194132 Free PMC article. Review.
Cited by
-
MeshDeform: Surface Reconstruction of Subcortical Structures in Human Brain MRI.Inf Process Med Imaging. 2023 Jun;13939:536-547. doi: 10.1007/978-3-031-34048-2_41. Epub 2023 Jun 8. Inf Process Med Imaging. 2023. PMID: 37915753 Free PMC article.
-
Comprehensive shape analysis of the cortex in Huntington's disease.Hum Brain Mapp. 2023 Mar;44(4):1417-1431. doi: 10.1002/hbm.26125. Epub 2022 Nov 21. Hum Brain Mapp. 2023. PMID: 36409662 Free PMC article.
-
Structural neuroimaging differentiates vulnerability from disease manifestation in colombian families with Huntington's disease.Brain Behav. 2019 Aug;9(8):e01343. doi: 10.1002/brb3.1343. Epub 2019 Jul 5. Brain Behav. 2019. PMID: 31276317 Free PMC article.
-
Mechanistic Modeling of Longitudinal Shape Changes: Equations of Motion and Inverse Problems.SIAM J Appl Dyn Syst. 2022;21(1):80-101. doi: 10.1137/21m1423099. SIAM J Appl Dyn Syst. 2022. PMID: 38606305 Free PMC article.
-
xIV-LDDMM Toolkit: A Suite of Image-Varifold Based Technologies for Representing and Mapping 3D Imaging and Spatial-omics Data Simultaneously Across Scales.bioRxiv [Preprint]. 2025 Jun 14:2024.11.04.621983. doi: 10.1101/2024.11.04.621983. bioRxiv. 2025. PMID: 39574713 Free PMC article. Preprint.
References
-
- Albin, R. L. , Reiner, A. , Anderson, K. D. , Dure, L. S. , Handelin, B. , Balfour, R. , … Young, A. B. (1992). Preferential loss of striato‐external pallidal projection neurons in presymptomatic Huntington's disease. Annals of Neurology, 31, 425–430. - PubMed
-
- Alexander, G. E. , DeLong, M. R. , & Strick, P. L. (1986). Parallel organization of functionally segregated circuits linking basal ganglia and cortex. Annual Review of Neuroscience, 9, 357–381. - PubMed
-
- Andrew, S. E. , Paul Goldberg, Y. , Kremer, B. , Telenius, H. , Theilmann, J. , Adam, S. , … Hayden, M. R. (1993). The relationship between trinucleotide (CAG) repeat length and clinical features of Huntington's disease. Nature Genetics, 4, 398. - PubMed
Publication types
MeSH terms
Grants and funding
- 20150306/Shunde International Joint Research Institute Start-up Grant/International
- A3917/CHDI Foundation/International
- NIH R21 NS088302/NH/NIH HHS/United States
- R01 NS040068/NS/NINDS NIH HHS/United States
- R21 NS088302/NS/NINDS NIH HHS/United States
- R01 EB008171/EB/NIBIB NIH HHS/United States
- NIH R01 EB008171/NH/NIH HHS/United States
- NSFC 81501546/National Natural Science Foundation of China/International
- 2017YFC0112404/National Key R&D Program of China/International
- NS40068/NS/NINDS NIH HHS/United States
- NIH P41 EB015909/NH/NIH HHS/United States
- R01 EB000975/EB/NIBIB NIH HHS/United States
- P50 NS091856/NS/NINDS NIH HHS/United States
- NIH R01 EB000975/NH/NIH HHS/United States
- U01 NS082085/NS/NINDS NIH HHS/United States
- P41 EB015909/EB/NIBIB NIH HHS/United States
- NIH P50 NS091856/NH/NIH HHS/United States
