. 2019 Apr;143(4):463-471.
doi: 10.5858/arpa.2018-0336-CP. Epub 2018 Oct 30.

Proficiency Testing of Standardized Samples Shows Very High Interlaboratory Agreement for Clinical Next-Generation Sequencing-Based Oncology Assays

Affiliations

Proficiency Testing of Standardized Samples Shows Very High Interlaboratory Agreement for Clinical Next-Generation Sequencing-Based Oncology Assays

Jason D Merker et al. Arch Pathol Lab Med. 2019 Apr.

Abstract

Context.—: Next-generation sequencing-based assays are being increasingly used in the clinical setting for the detection of somatic variants in solid tumors, but limited data are available regarding the interlaboratory performance of these assays.

Objective.—: To examine proficiency testing data from the initial College of American Pathologists (CAP) Next-Generation Sequencing Solid Tumor survey to report on laboratory performance.

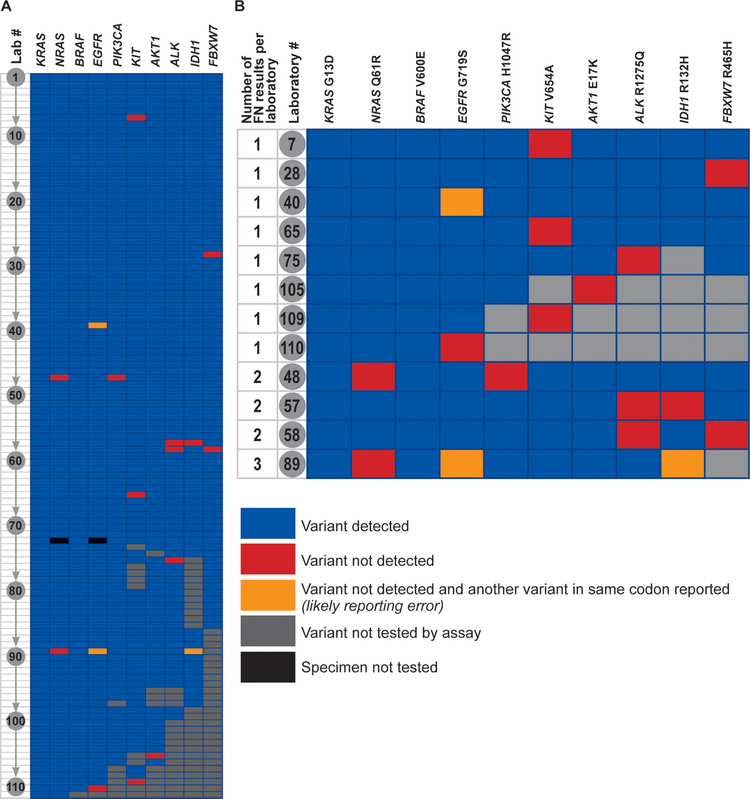
Design.—: CAP proficiency testing results from 111 laboratories were analyzed for accuracy and associated assay performance characteristics.

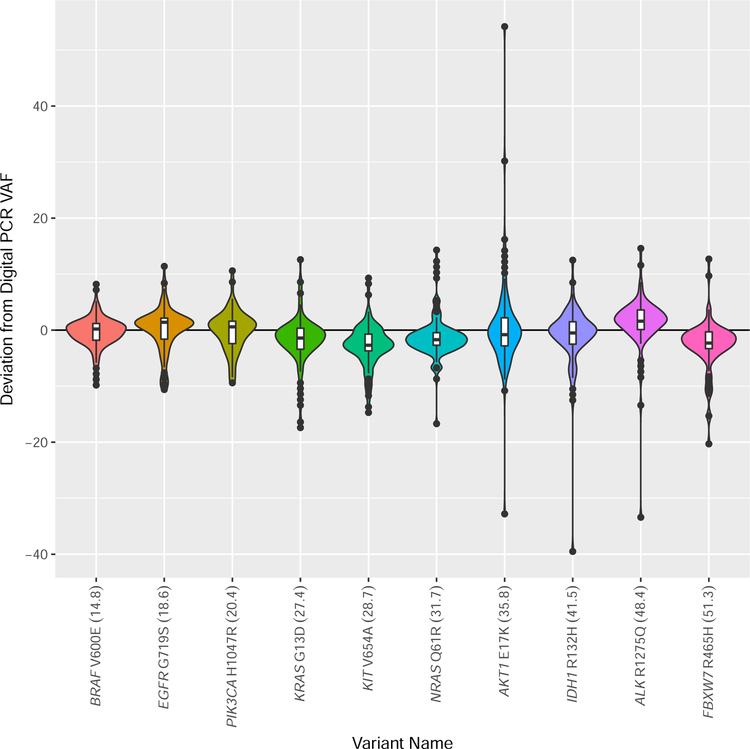
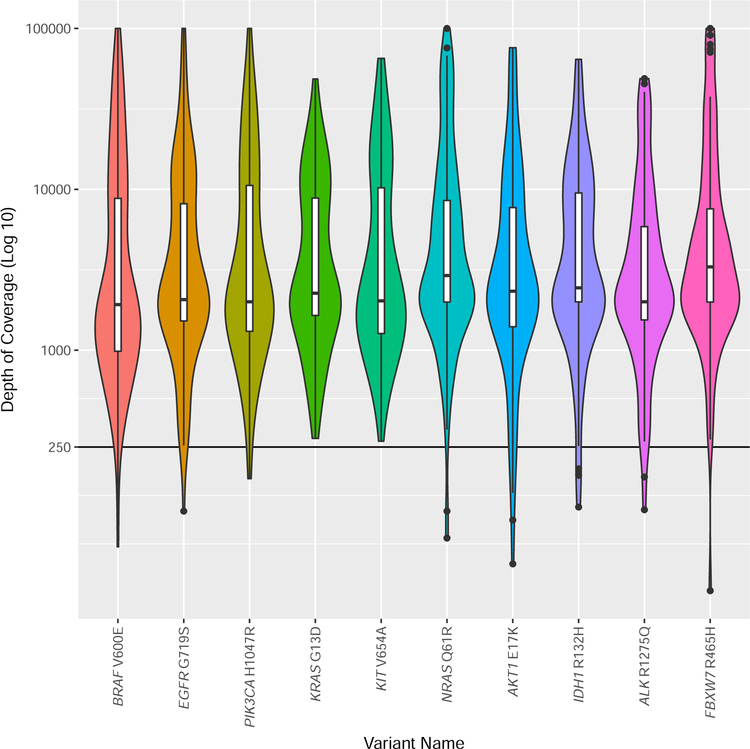
Results.—: The overall accuracy observed for all variants was 98.3%. Rare false-negative results could not be attributed to sequencing platform, selection method, or other assay characteristics. The median and average of the variant allele fractions reported by the laboratories were within 10% of those orthogonally determined by digital polymerase chain reaction for each variant. The median coverage reported at the variant sites ranged from 1922 to 3297.

Conclusions.—: Laboratories demonstrated an overall accuracy of greater than 98% with high specificity when examining 10 clinically relevant somatic single-nucleotide variants with a variant allele fraction of 15% or greater. These initial data suggest excellent performance, but further ongoing studies are needed to evaluate the performance of lower variant allele fractions and additional variant types.


Figures

Figure 1 –
Figure 1 –
Performance of individual laboratories. A – Each laboratory is represented as a row numbered from 1 through 111, and each of the 10 variants is represented by a column. Individual cell colors represent the following: blue – variant was detected by the laboratory, red – variant was not detected by the laboratory, yellow – variant was not detected by the laboratory, and the laboratory reported another variant in the same codon (this is likely a post-analytical or reporting error), grey – this particular variant is not tested for by the laboratory’s assay, black – specimen not tested. B – Performance data from the 12 laboratories with false-negative results. FN – False-negative.
Figure 2 –
Figure 2 –
Violin plot demonstrating the deviation of the variant allele fraction (VAF) reported by the participating laboratories from the VAF measured by digital polymerase chain reaction (PCR). The VAF measured by digital PCR for each variant is provided as a percentage in parentheses after each variant name on the x-axis. The width of each violin plot indicates the number of laboratories that reported the different VAFs. The violin plots contain a box that represents the lower and upper quartiles, and the solid line drawn across the box indicates the median value. The interquartile range (IQ) is the difference between the upper (Q3) and lower (Q1) quartiles. The extent of the vertical lines extending from the boxes within each violin plot represent the upper or lower inner fence, where a lower inner fence is defined as Q1–1.5*(IQ) and an upper inner fence as Q3+1.5*(IQ). Outliers, drawn as black dots, are observations that fall outside the upper or lower inner fences.
Figure 3 –
Figure 3 –
Violin plot of the depth of coverage reported by the laboratories for each variant. Depth of coverage is plotted as (Log10) of coverage. The width of each violin plot indicates the number of laboratories that reported the different depth of coverage. The violin plots contain a box that represents the lower and upper quartiles, and the solid line drawn across the box indicates the median value. The interquartile range (IQ) is the difference between the upper (Q3) and lower (Q1) quartiles. The extent of the vertical lines extending from the boxes within each violin plot represent the upper or lower inner fence, where a lower inner fence is defined as Q1–1.5*(IQ) and an upper inner fence as Q3+1.5*(IQ). Outliers, drawn as black dots, are observations that fall outside the upper or lower inner fences.

References

    1. Allen NE, Sudlow C, Peakman T, Collins R. UK biobank data: come and get it. Sci Transl Med 2014;6(224):224ed224. - PubMed
    1. Laverty H, Goldman M. Editorial: The Innovative Medicines Initiative--collaborations are key to innovating R&D processes. Biotechnol J 2014;9(9):1095–1096. - PubMed
    1. Collins FS, Varmus H. A new initiative on precision medicine. N Engl J Med 2015;372(9):793–795. - PMC - PubMed
    1. Singer DS, Jacks T, Jaffee E. A U.S. “Cancer Moonshot” to accelerate cancer research. Science 2016;353(6304):1105–1106. - PubMed
    1. Bombard Y, Bach PB, Offit K. Translating genomics in cancer care. J Natl Compr Canc Netw 2013;11(11):1343–1353. - PubMed

Publication types

MeSH terms