. 2018 Oct 30;13(10):e0199929.
doi: 10.1371/journal.pone.0199929. eCollection 2018.

The temporal organization of mouse ultrasonic vocalizations

Affiliations

The temporal organization of mouse ultrasonic vocalizations

Gregg A Castellucci et al. PLoS One. .

Abstract

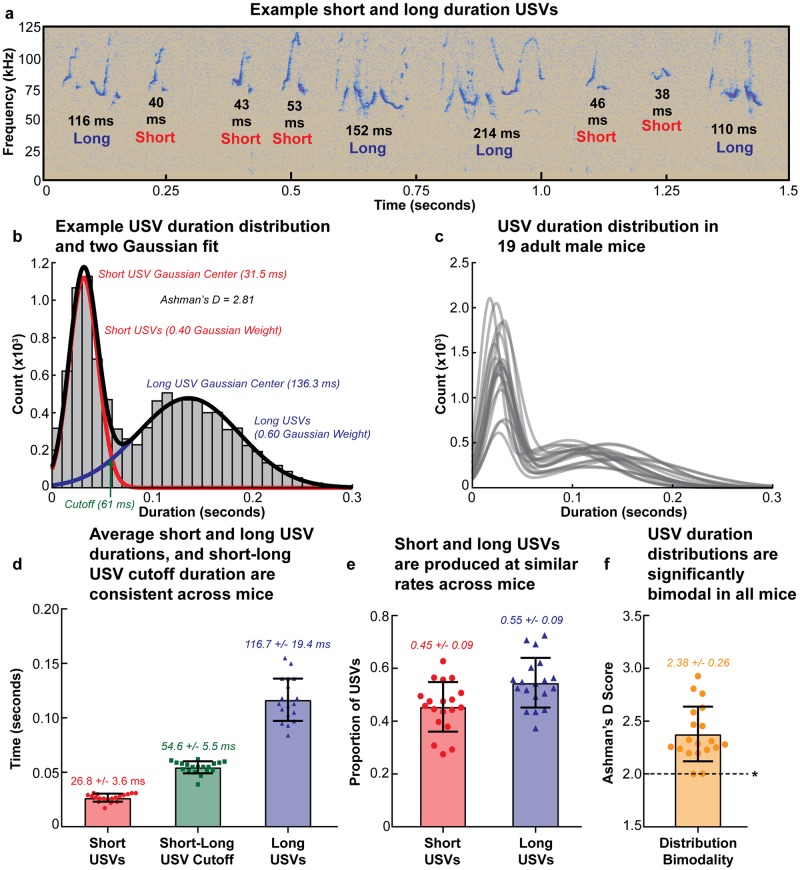
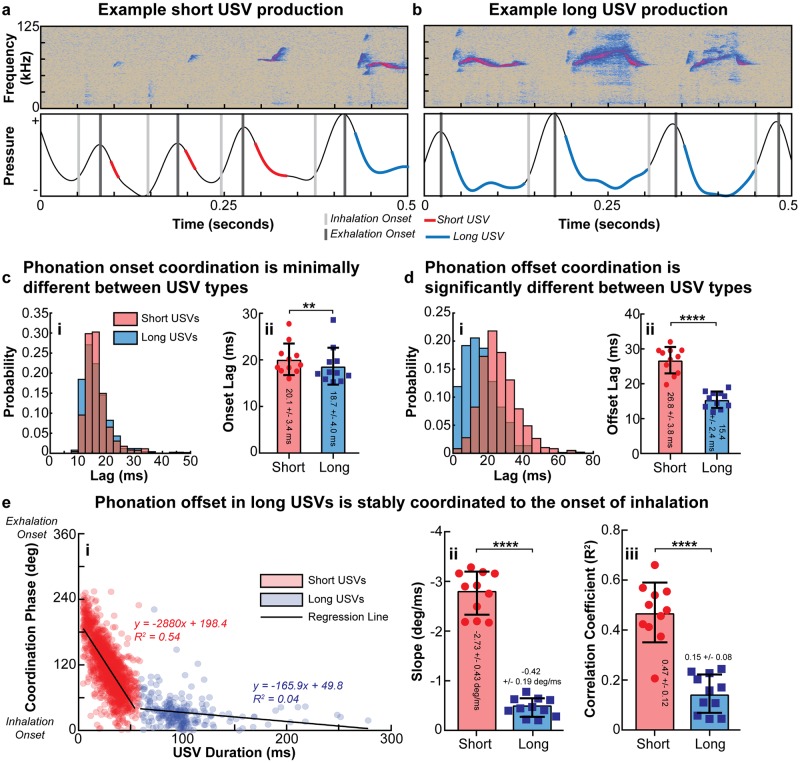
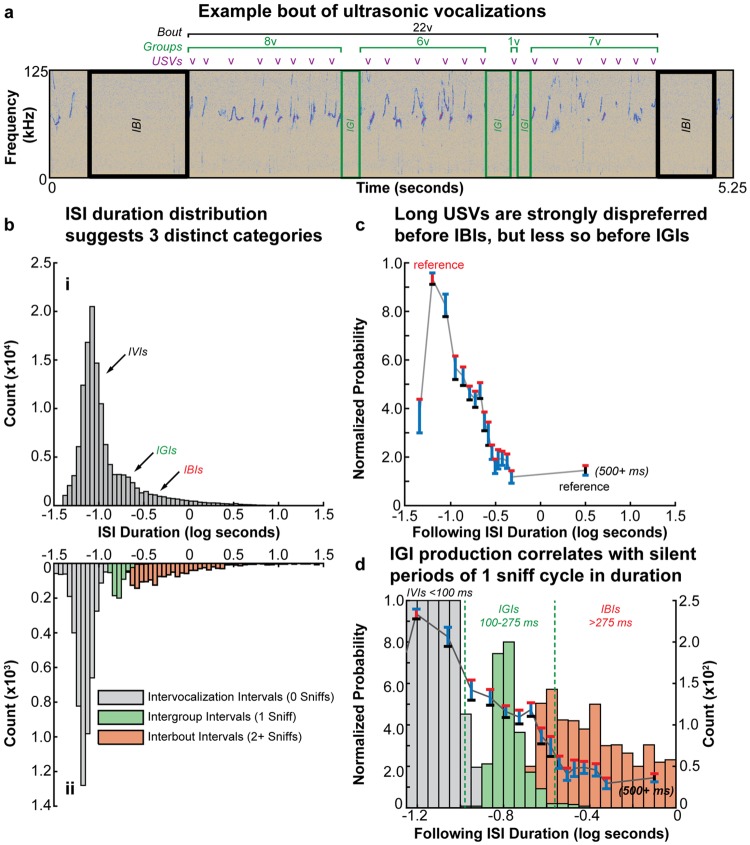
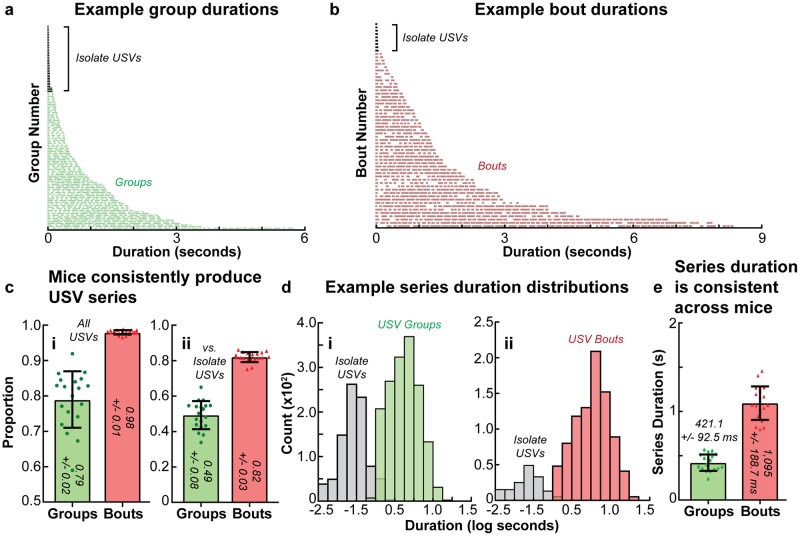
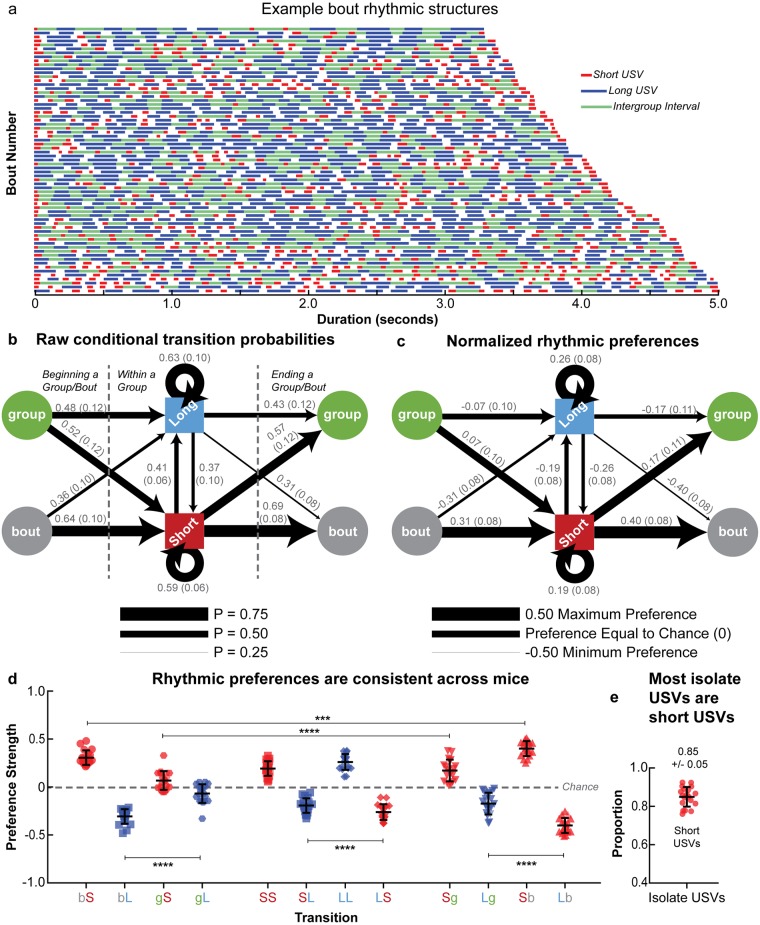
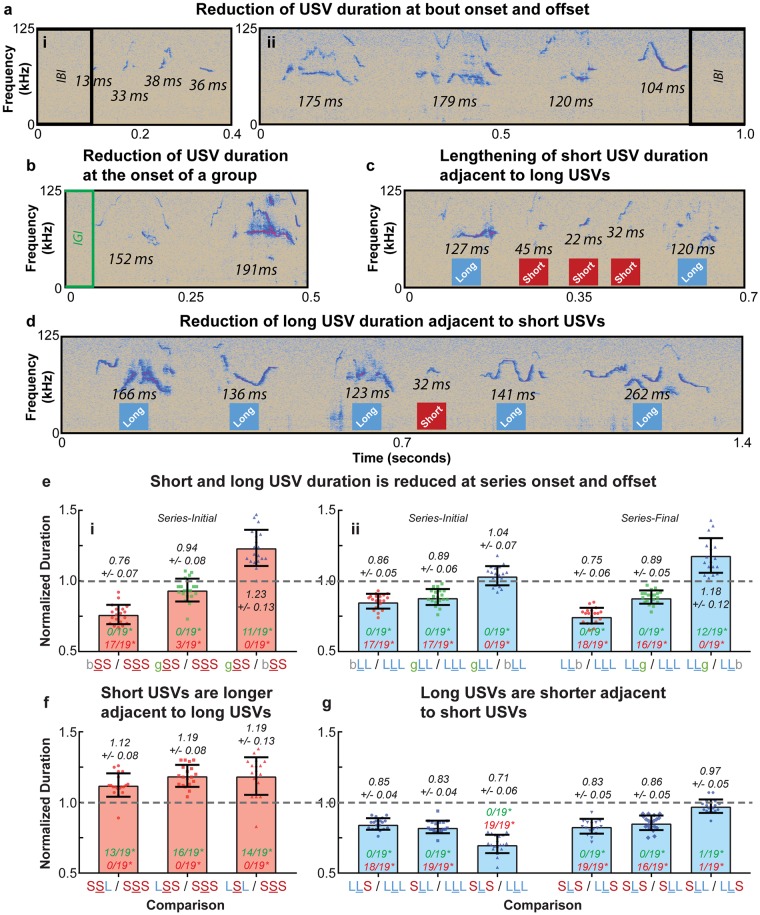
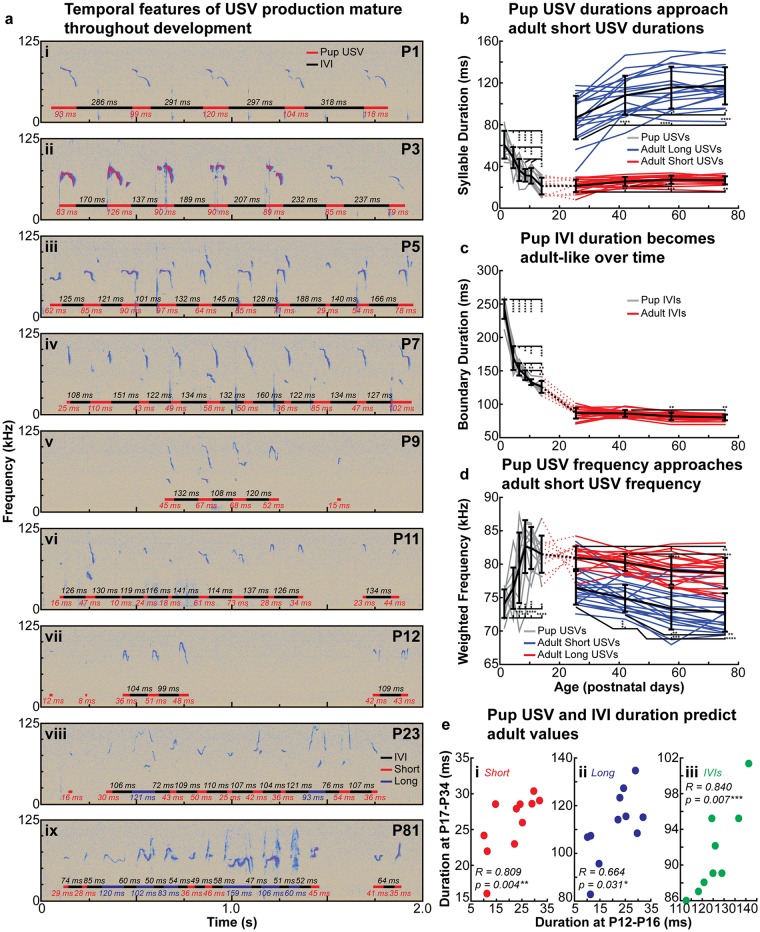
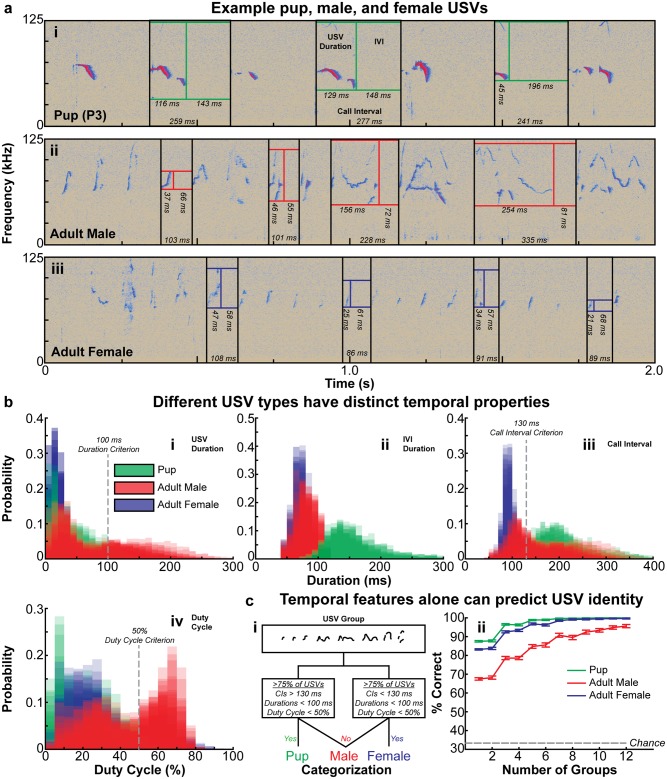
House mice, like many tetrapods, produce multielement calls consisting of individual vocalizations repeated in rhythmic series. In this study, we examine the multielement ultrasonic vocalizations (USVs) of adult male C57Bl/6J mice and specifically assess their temporal properties and organization. We found that male mice produce two classes of USVs which display unique temporal features and arise from discrete respiratory patterns. We also observed that nearly all USVs were produced in repetitive series exhibiting a hierarchical organization and a stereotyped rhythmic structure. Furthermore, series rhythmicity alone was determined to be sufficient for the mathematical discrimination of USVs produced by adult males, adult females, and pups, underscoring the known importance of call timing in USV perception. Finally, the gross spectrotemporal features of male USVs were found to develop continuously from birth and stabilize by P50, suggesting that USV production in infants and adults relies on common biological mechanisms. In conclusion, we demonstrate that the temporal organization of multielement mouse USVs is both stable and informative, and we propose that call timing be explicitly assessed when examining mouse USV production. Furthermore, this is the first report of putative USV classes arising from distinct articulatory patterns in mice, and is the first to empirically define multielement USV series and provide a detailed description of their temporal structure and development. This study therefore represents an important point of reference for the analysis of mouse USVs, a commonly used metric of social behavior in mouse models of human disease, and furthers the understanding of vocalization production in an accessible mammalian species.


Conflict of interest statement

The authors have declared that no competing interests exist.

Figures

Fig 1
Fig 1. C57Bl/6J mice produce temporally distinct USV classes.
(a) Example spectrogram showing short and long USVs in adult male ultrasonic courtship vocalizations. (b) Example histogram of USV duration for one mouse with the fit of two Gaussians overlaid. Also labelled are the Gaussian centers and Gaussian weights, the intercept of the two Gaussian distributions representing the cutoff between short and long USVs in the animal, and the Ashman’s D score for the distribution. (c) The sum of the fit of two Gaussians to the USV duration distributions from all 19 adult mice. (d) The average Gaussian centers from the duration distributions of short and long USVs in all 19 mice, as well as the cutoff values between the two distributions. (e) The average proportions of short and long USVs produced by all 19 mice. (f) The Ashman’s D scores for each of the 19 animals’ USV duration distributions; a score of 2 or greater represents significant separation between two distributions. In (d-f), error bars indicate the mean across mice +/-1 standard deviation, and values for individual mice are represented by the 19 overlaid points. Summary statistics for (d-f) are presented in S1 Table.
Fig 2
Fig 2. Short and long USVs arise from distinct articulatory patterns.
Example spectrograms (top) and simultaneous respiratory activity (bottom) during the production of (a) short and (b) long USVs by an adult mouse. (c.i) Example onset lag histograms for short and long USVs in one mouse, and (c.ii) mean onset lags for short and long USVs across all 11 mice. (d.i) Example offset lag histograms for short and long USVs in one mouse, and (d.ii) mean offset lags for short and long USVs across all 11 mice. Additional statistic details for (c-d) are presented in S2 and S3 Tables, respectively. (e.i) Example scatterplot of offset coordination as a function of USV duration in 1 mouse with linear regression lines for both short and long USVs overlaid; short USVs displayed a strong correlation between offset coordination and USV duration while long USVs did not. Mean linear regression (e.ii) slope and (e.iii) correlation coefficient for short and long USVs across all 11 mice. Additional statistical details for comparisons in (e) are presented in S4 Table. In (e), linear regressions were significant for both USV types in all 11 animals; statistical details are presented in S5 Table. In (c-f), error bars indicate the mean across animals +/-1 standard deviation, and values for individual mice are represented by the 11 overlaid points.
Fig 3
Fig 3. Intervening silent interval classes exhibit unique features.
(a) Example spectrogram showing a bout of 22 USVs produced by an adult mouse. Three distinct ISI categories were observed: short duration IVIs separating individual USVs, medium duration IGIs separating groups of USVs, and long duration IBIs separating bouts of USV groups. (b.i) Pooled histogram of ISI durations produced by all 19 mice in all adult recording sessions. (b.ii) Pooled histogram of ISI durations from 11 adult mice from all freely moving plethysmography sessions. ISIs arising from silent inhalations (0 complete sniff cycles), 1 nonvocal sniff cycle, or 2+ nonvocal sniff cycles are indicated; the corresponding distributions in (b.i) are indicated with arrows. (c) The normalized probability of observing a long USV as a function of following ISI duration. Long USV production was most likely prior to IVIs 50-75 ms (red vertical bar) in duration and least likely prior to IBIs 500+ ms in duration (black vertical bar). However, a plateau of intermediate probability which was significantly higher than prior to IBIs (black lower error bars) and significantly lower than prior to IVIs (red upper error bars) was observed for ISIs 100-275 ms in duration, which were designated as IGIs (p < 0.05, repeated measures one-way ANOVA with Dunnett’s correction for multiple comparisons; see S6 Table for additional statistical details). (d) The plot in (c) superimposed over the histogram in (b.i); the plateau of intermediate long USV production probability (IGIs) corresponds to silent intervals arising from a single nonvocal sniff cycle. In (c-d), error bars indicate the mean across animals +/-1 standard error.
Fig 4
Fig 4. USV series production is consistent across mice.
Example (a) group and (b) bout durations in a single recording session of an adult mouse, with isolate USVs indicated. Series and isolate USVs are stacked according to duration, with the shortest on top and the start of the vocal unit on the left. Each individual line represents a USV and white spaces between lines represent ISIs, with the size of the lines and white spaces representing to scale the duration of the USVs and ISIs, respectively. The mean proportion of (ci) of USVs produced in groups and bouts, and (cii) groups and bouts as opposed to isolate USVs. Additional statistical details are presented in S8 Table. Histograms of isolate USV and (di) group and (dii) bout duration from all recording sessions of one adult mouse; isolate USVs and USV series form distinct distributions. (e) Mean duration of groups and bouts across all 19 mice. Additional statistical details are presented in S9 Table. In (e), mean durations are transformed from log seconds to represent series duration with a more familiar measure. In (c) and (e), error bars indicate the mean across animals +/-1 standard deviation, and values for individual mice are represented by the 19 overlaid points.
Fig 5
Fig 5. Series rhythmic structure is consistent across mice.
(a) Example bouts produced by an adult mouse. Bouts are stacked according to duration, with the shortest on top and the start of the bouts on the left. Red lines indicate short USVs, blue lines indicate long USVs, green lines indicate IGIs, and white spaces indicate IVIs, with the length of the lines and spaces representing to scale the duration of the USVs and ISIs. Mean (b) raw conditional probabilities and (c) normalized Preference Scores for each transition across all 19 mice. The numbers adjacent to the bars indicating the transition represent the mean across mice with the standard deviation in parentheses. Additional statistical details are presented in S11 and S12 Tables for (b) and (c), respectively. (d) Average Preference Scores for each transition in all 19 adult mice, depicting the values for individual mice. (e) Proportion of isolate USVs observed to be short USVs. In (d) and (e), error bars indicate the mean across animals +/-1 standard deviation, and values for individual mice are represented by the 19 overlaid points. In (b-c), IGIs are represented by the green circles while IBIs are indicated by the grey circles. In (d), “b”, “g”, “S”, and “L” correspond to IBIs, IGIs, short USVs, and long USVs, respectively.
Fig 6
Fig 6. USV series exhibit consistent fine-scale temporal structure.
(a) Example spectrogram from an adult male mouse showing reduction of USV duration (a.i) bout-initially (a.ii) bout-finally. (b) Example spectrogram from an adult mouse depicting reduction of long USV duration group-initially. Example spectrograms of USVs produced by an adult mouse demonstrating (c) the reduction of long USV duration adjacent to a short USV, and (d) the lengthening of short USV duration adjacent to long USVs. (e.i) Average normalized durations of short USVs at series onset across all 19 mice. Short USVs were significantly shorter at bout onset in a majority of mice, but not group onset (see S14 and S15 Tables for statistical details). (e.ii) Average normalized durations of long USVs series-initially (left) and series-finally (right). In most mice, long USVs were significantly shorter at the onset and offset of both groups and bouts, and were significantly shorter at bout offset compared to group offset (see S14 and S16 Tables for statistical details). (f) Average normalized durations of short USVs adjacent to long USVs across all 19 adult mice. In a majority of mice, short USVs were significantly longer when adjacent to long USVs. See S18 and S19 Tables for statistical details. (g) Average normalized durations of long USVs adjacent to short USVs across all adult 19 mice. In all environments examined, long USVs were significantly shorter when adjacent to short USVs in nearly all mice. See S18 and S20 Tables for statistical details. In (e-g), “b”, “g”, “S”, and “L” correspond to IBIs, IGIs, short USVs, and long USVs, respectively. Values on the plots are represented as normalized durations between the two trigrams listed on the x-axis. For example “bSS/SSS” indicates the mean duration of bout-initial short USVs (S) preceding a short USV normalized to the mean duration of short USV (S) flanked by short USVs. Error bars indicate the mean across animals +/-1 standard deviation, and values for individual mice are represented by the 19 overlaid points. The number of mice showing a significant reduction or lengthening of USV duration for each comparison is written in red and green, respectively. Summary statistics for (e) and (f-g) are presented in S17 and S21 Tables, respectively.
Fig 7
Fig 7
(a) Example spectrograms of USVs produced by a single mouse throughout development. (b) Mean pup USV, short USV, and long USV duration across mice over time. (c) Mean IVI duration across mice throughout development. (d) Mean weighted frequency of pup USVs, short USVs, and long USVs over time. (e) Mean pup USV duration at P12-P16 was significantly correlated with mean (e.i) short USV and (e.ii) long USV duration at P17-P34; (e.iii) median IVI duration at P12-P16 was also significantly correlated with median IVI at P17-P34. In (b-d), significance is assessed with repeated-measures one-way ANOVAs with Tukey’s correction for multiple comparisons; see S27 and S28 Tables for statistical details. Summary statistics are presented in S25 and S26 Tables. Error bars indicate the mean value across animals +/- 1 standard deviation. Individual lines indicate the values for each mouse. In (e), Spearman’s R and p-values for the correlation are labelled on the respective plots.
Fig 8
Fig 8. Call temporal features discriminate different USV types.
(a) Example spectrograms of USVs produced by (a.i) a mouse pup, (a.ii) an adult female mouse, and (a.iii) an adult male mouse, with USV duration, IVI duration, and call interval values labelled. (b) Histograms depicting the distribution of (b.i) USV duration, (b.ii) IVI duration, (b.iii) call interval, and (b.iv) duty cycle values from 11 pups (P0-P16), 19 adult males (P50-P95), and 15 adult female mice (all >4 months). For each USV type, histograms from individuals are transparent and plotted on the same axes to illustrate the variability within and across mice. (c.i) Overview of the classifier used to categorize groups of USVs produced by pups, adult females, or adult males. (c.ii) Performance of the classifier on a subset of 250 randomly selected groups of USVs produced by pups, adult females, or adult males over 100 iterations as a function of the number of groups used for classification. Error bars indicate the mean across iterations and the 95% confidence interval (see S29 Table for summary statistics and statistical details).

Similar articles

Cited by

References

    1. Grimsley JMS, Monaghan JJM, Wenstrup JJ. Development of Social Vocalizations in Mice. PLoS ONE. 2011;6(3):e17460 10.1371/journal.pone.0017460 - DOI - PMC - PubMed
    1. Noirot E, Pye D. Sound analysis of ultrasonic distress calls of mouse pups as a function of their age. Animal Behaviour. 1969;17:340–349. 10.1016/0003-3472(69)90020-7 - DOI
    1. Portfors CV. Types and Functions of Ultrasonic Vocalizations in Laboratory Rats and Mice. Journal of the American Association for Laboratory Animal Science. 2007;46(1):7. - PubMed
    1. Hammerschmidt K, Radyushkin K, Ehrenreich H, Fischer J. The Structure and Usage of Female and Male Mouse Ultrasonic Vocalizations Reveal only Minor Differences. PLoS ONE. 2012;7(7):e41133 10.1371/journal.pone.0041133 - DOI - PMC - PubMed
    1. Maggio JC, Whitney G. Ultrasonic Vocalizing by Adult Female Mice (Mus musculus). Journal of Comparative Psychology. 1985;99(4):420–436. 10.1037/0735-7036.99.4.420 - DOI - PubMed

Publication types