. 2018 Oct 30;16(10):e2006040.
doi: 10.1371/journal.pbio.2006040. eCollection 2018 Oct.

QTL mapping of natural variation reveals that the developmental regulator bruno reduces tolerance to P-element transposition in the Drosophila female germline

Affiliations

QTL mapping of natural variation reveals that the developmental regulator bruno reduces tolerance to P-element transposition in the Drosophila female germline

Erin S Kelleher et al. PLoS Biol. .

Abstract

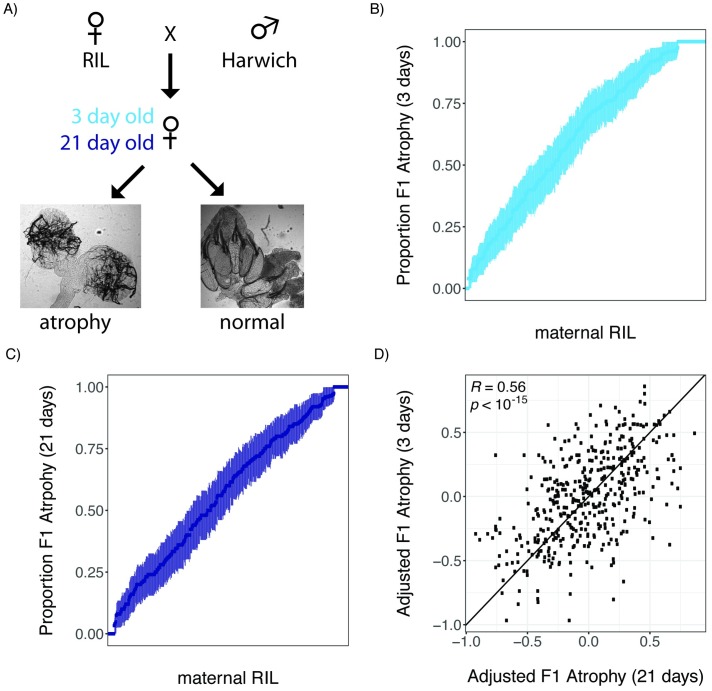
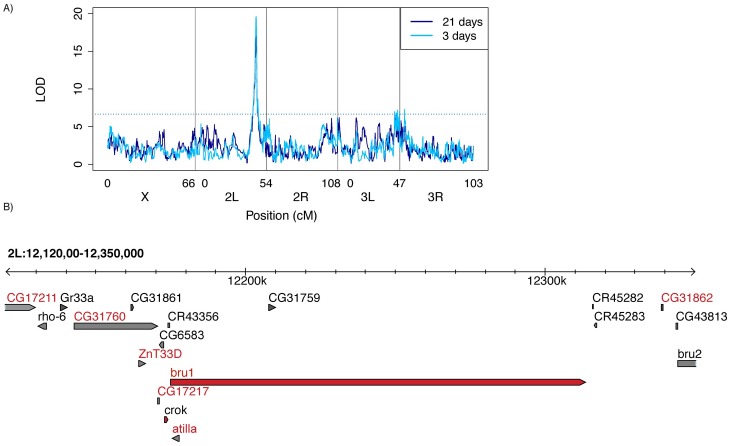
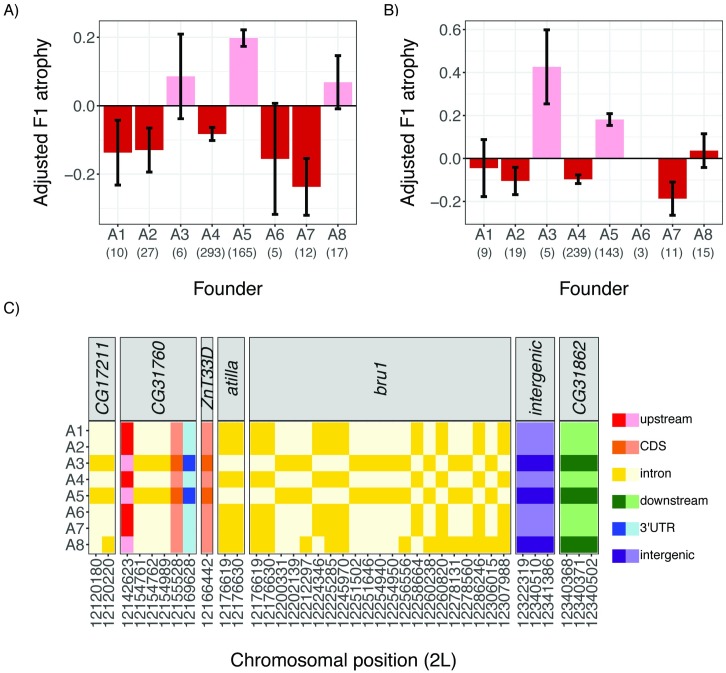
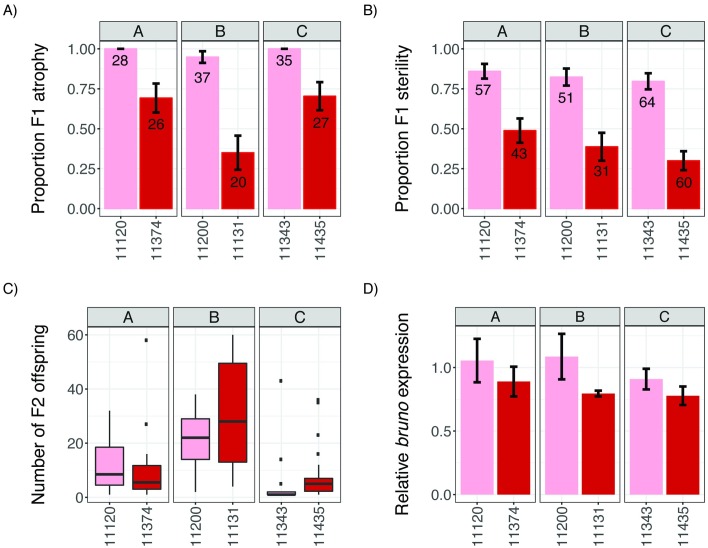
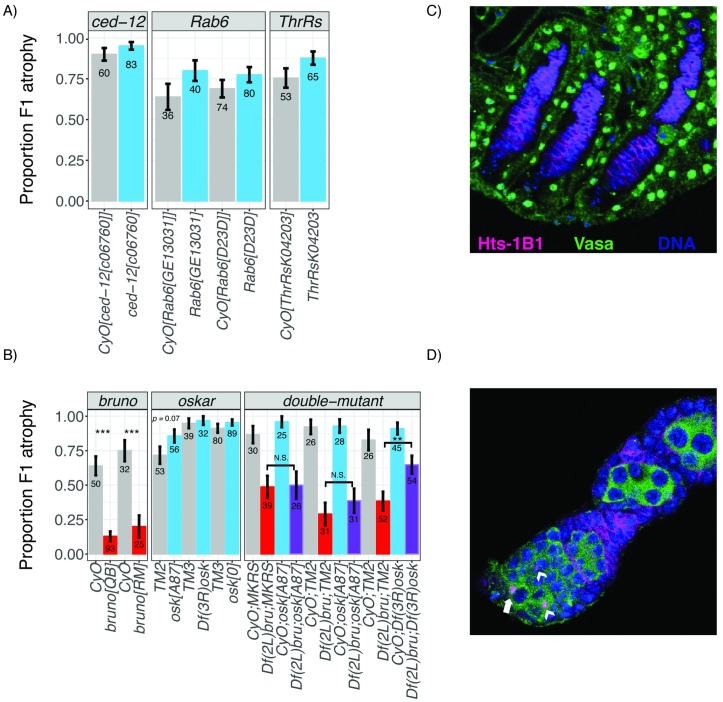
Transposable elements (TEs) are obligate genetic parasites that propagate in host genomes by replicating in germline nuclei, thereby ensuring transmission to offspring. This selfish replication not only produces deleterious mutations-in extreme cases, TE mobilization induces genotoxic stress that prohibits the production of viable gametes. Host genomes could reduce these fitness effects in two ways: resistance and tolerance. Resistance to TE propagation is enacted by germline-specific small-RNA-mediated silencing pathways, such as the Piwi-interacting RNA (piRNA) pathway, and is studied extensively. However, it remains entirely unknown whether host genomes may also evolve tolerance by desensitizing gametogenesis to the harmful effects of TEs. In part, the absence of research on tolerance reflects a lack of opportunity, as small-RNA-mediated silencing evolves rapidly after a new TE invades, thereby masking existing variation in tolerance. We have exploited the recent historical invasion of the Drosophila melanogaster genome by P-element DNA transposons in order to study tolerance of TE activity. In the absence of piRNA-mediated silencing, the genotoxic stress imposed by P-elements disrupts oogenesis and, in extreme cases, leads to atrophied ovaries that completely lack germline cells. By performing quantitative trait locus (QTL) mapping on a panel of recombinant inbred lines (RILs) that lack piRNA-mediated silencing of P-elements, we uncovered multiple QTL that are associated with differences in tolerance of oogenesis to P-element transposition. We localized the most significant QTL to a small 230-kb euchromatic region, with the logarithm of the odds (LOD) peak occurring in the bruno locus, which codes for a critical and well-studied developmental regulator of oogenesis. Genetic, cytological, and expression analyses suggest that bruno dosage modulates germline stem cell (GSC) loss in the presence of P-element activity. Our observations reveal segregating variation in TE tolerance for the first time, and implicate gametogenic regulators as a source of tolerant variants in natural populations.


Conflict of interest statement

The authors have declared that no competing interests exist.

Figures

Fig 1
Fig 1. Heritable phenotypic variation in tolerance of P-element activity in the female germline.
(A) Crossing scheme for documenting variation in tolerance of P-element activity among RIL offspring, including representative images of atrophied and normal ovaries. (B and C) Phenotypic variation in the proportion of 3-day-old (B) and 21-day-old (C) F1 female offspring of different RILs. RILs are sorted according to the proportion of F1 atrophy observed in their offspring, and error bars indicate the standard error of the estimated proportion. (D) Scatterplot of the arsine-transformed proportion of F1 atrophy observed among 3-day-old and 21-day-old offspring of the same line, after accounting for the effects of experimenter and experimental block. The individual numerical values for panels B, C, and D can be found in S1, S2 and S3 Data, respectively. F1, filial 1; RIL, recombinant inbred line.
Fig 2
Fig 2. QTL mapping of variation in P-element tolerance.
(A) LOD ratio of the observed association between maternal RIL genotype [29] and the adjusted proportion of F1 atrophy phenotype. Higher LOD scores correspond to stronger evidence of linkage, and significant LOD scores are above the threshold (dotted line), which was obtained from 1,000 permutations of the observed data. (B) Two LOD drop confidence interval of the QTL peak based on a combined QTL analysis including both 3-day-old and 21-day-old F1 females. Genes indicated by red letters are potentially affected by polymorphisms in the RIL founders that are in phase with the inferred allelic classes (Fig 3 [46]). Gene models indicated in red are highly expressed in the Drosophila melanogaster ovary [47]. The individual numerical values required to generate LOD plots for 3-day-old and 21-day-old F1 females can be found in S4 and S5 Data, respectively. bru1, bruno; bru2, bruno-2; cM, centimorgan; crok, crooked; F1, filial 1; LOD, logarithm of the odds; P-element; QTL, quantitative trait locus; rho-6, rhomboid 6; RIL, recombinant inbred line.
Fig 3
Fig 3. Phenotypic classes of founder alleles at the major QTL peak.
The mean adjusted F1 atrophy among 3-day-old females (A) and 21-day-old females (B) is shown for RILs carrying each of the eight founder alleles. Error bars denote standard error. QTL phasing (see Materials and methods) detects two allelic classes for both the 3-day-old and 21-day-old phenotypes: a sensitive allele that increases the odds of F1 ovarian atrophy (pink) and a tolerant allele that decreases the odds of F1 ovarian atrophy (red). The assignment of founder alleles to phenotypic classes across ages is consistent for all founders except A8. (C) In-phase SNPs in Population A RIL founder genomes, indicated by their position in the Drosophila melanogaster reference assembly (dm6, [45]). SNPs are colored according to the function of the affected sequence, and shaded according to whether the founder exhibits the reference (light) or alternate (dark) allele. The individual numerical values required to generate bar plots for panels A and B can be found in S4 and S5 Data, respectively. In-phase polymorphisms represented in panel C are provided in S1 Table. bru1, bruno CDS, coding sequence; dm6, Drosophila melanogaster reference assembly; F1,filial 1; QTL, quantitative trait locus; RIL, recombinant inbred line; SNP, single nucleotide polymorphism.
Fig 4
Fig 4. Tolerant alleles are associated with enhanced fertility and reduced bruno expression.
Phenotypes of background-matched RILs (A, B, and C) carrying sensitive (A5, pink) and tolerant (A4, red) haplotypes across the QTL peak are compared. (A-B) Incidence of ovarian atrophy (A) and sterility (B) among dysgenic F1 female offspring of crosses between RIL females and Harwich males. Numbers in each bar indicate the sample size. (C) Offspring production of fertile F1 females from B. (D) Ovarian bruno expression relative to rpl32 in each RIL. Error bars in A, B, and D indicate the standard error. The individual numerical values required to generate bar and box plots for panels A, B/C, and D can be found in S6, S7 and S8 Data, respectively. F1, filial 1; F2, filial 2; QTL, quantitative trait locus; RIL, recombinant inbred line.
Fig 5
Fig 5. Mutational analysis of candidate genes.
(A) Loss-of-function heterozygotes for three candidate genes are compared to their siblings, inheriting the balancer chromosome CyO in order to detect zygotic effects on the incidence of ovarian atrophy among 3–7-day-old dysgenic F1 offspring. (B) Single and double loss-of-function and deficiency heterozygotes for bruno and oskar are compared with their siblings inheriting the balancer chromosomes CyO (bruno) and TM2, TM3, or MKRS (oskar), in order to detect zygotic effects on the incidence of atrophy among 3–7-day-old dysgenic F1 offspring. Offspring from the same cross are represented consecutively on the graph. While bruno alleles act as consistent dominant suppressors in both single and double mutants, oskar deficiencies and mRNA null mutants exhibit only stochastic effects on the atrophy phenotype, suggesting that the mechanism of bruno suppression of F1 atrophy is independent of oskar mRNA function. (C-D) Representative germline development among atrophied and non-atrophied ovaries of brunoQB/+ and CyO/+ dysgenic offspring (B). (C) Atrophied ovaries lack any Vasa-positive germline cells in the ovarioles, including GSCs. Nuclear Vasa external to Hts-1B1 corresponds to the somatic ovarian sheath [35]. (D) Non-atrophied (i.e., morphologically normal) ovaries exhibit the full range of developing oocytes, including GSCs (white arrow). Arrowheads correspond to CBs, the undifferentiated daughters of GSCs. Representative ovaries in both C and D are CyO/+; however, atrophied ovaries (C) are more common among brunoQB/+ (B). Cytological markers for C and D are hu li tai shao (Hts-1B1), which labels somatic follicle cell membranes, the circular fusomes of GSCs and CBs, and the spectrosomes that connect cells in the developing cyst, and Vasa, which labels the cytoplasm of germline cells and nuclei of the ovarian sheath, and DAPI staining of nuclear DNA. The individual numerical values required to generate bar plots in panels A and B can be found in S9 and S10 Data, respectively. CB, cystoblast; CyO, Curly-O; F1, filial 1; GSC, germline stem cell; Hts-1B1, hu li tai shao; ThrRs, Threonyl-tRNA synthetase; TM2, third marked 2; TM3, third marked 3.

Comment in

References

    1. Chénais B, Caruso A, Hiard S, Casse N. The impact of transposable elements on eukaryotic genomes: from genome size increase to genetic adaptation to stressful environments. Gene. 2012;509: 7–15. 10.1016/j.gene.2012.07.042 - DOI - PubMed
    1. Vitte C, Panaud O. LTR retrotransposons and flowering plant genome size: emergence of the increase/decrease model. Cytogenet Genome Res. Karger Publishers; 2005;110: 91–107. 10.1159/000084941 - DOI - PubMed
    1. Sun C, Shepard DB, Chong RA, López Arriaza J, Hall K, Castoe TA, et al. LTR retrotransposons contribute to genomic gigantism in plethodontid salamanders. Genome Biol Evol. 2012;4: 168–83. 10.1093/gbe/evr139 - DOI - PMC - PubMed
    1. Kunarso G, Chia N-Y, Jeyakani J, Hwang C, Lu X, Chan Y-S, et al. Transposable elements have rewired the core regulatory network of human embryonic stem cells. Nat Genet. 2010;42: 631–4. 10.1038/ng.600 - DOI - PubMed
    1. Lynch VJ, Leclerc RD, May G, Wagner GP. Transposon-mediated rewiring of gene regulatory networks contributed to the evolution of pregnancy in mammals. Nat Genet. 2011;43: 1154–9. 10.1038/ng.917 - DOI - PubMed

Publication types

MeSH terms

LinkOut - more resources