. 2018 Oct 30;18(1):38.
doi: 10.1186/s12880-018-0280-6.

High-definition neural visualization of rodent brain using micro-CT scanning and non-local-means processing

Affiliations

High-definition neural visualization of rodent brain using micro-CT scanning and non-local-means processing

Ko-Chin Chen et al. BMC Med Imaging. .

Abstract

Background: Micro-CT holds promising potential for phenotyping and histological purposes. However, few have clarified the difference in the neuroimaging quality between ex vivo and in vivo micro-CT scanners. In addition, no direct comparison has been made between micro-CT scans and standard microscopy. Furthermore, while the efficacy of various stains for yielding soft-tissue contrast in CT scans have been compared in other studies for embryos, staining protocols for larger samples have yet to be clarified. Lastly, post-acquisition processing for image enhancements have not been addressed.

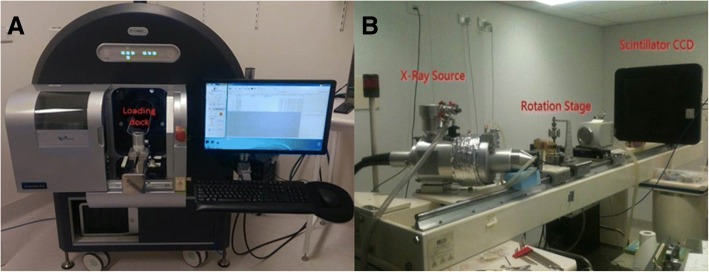
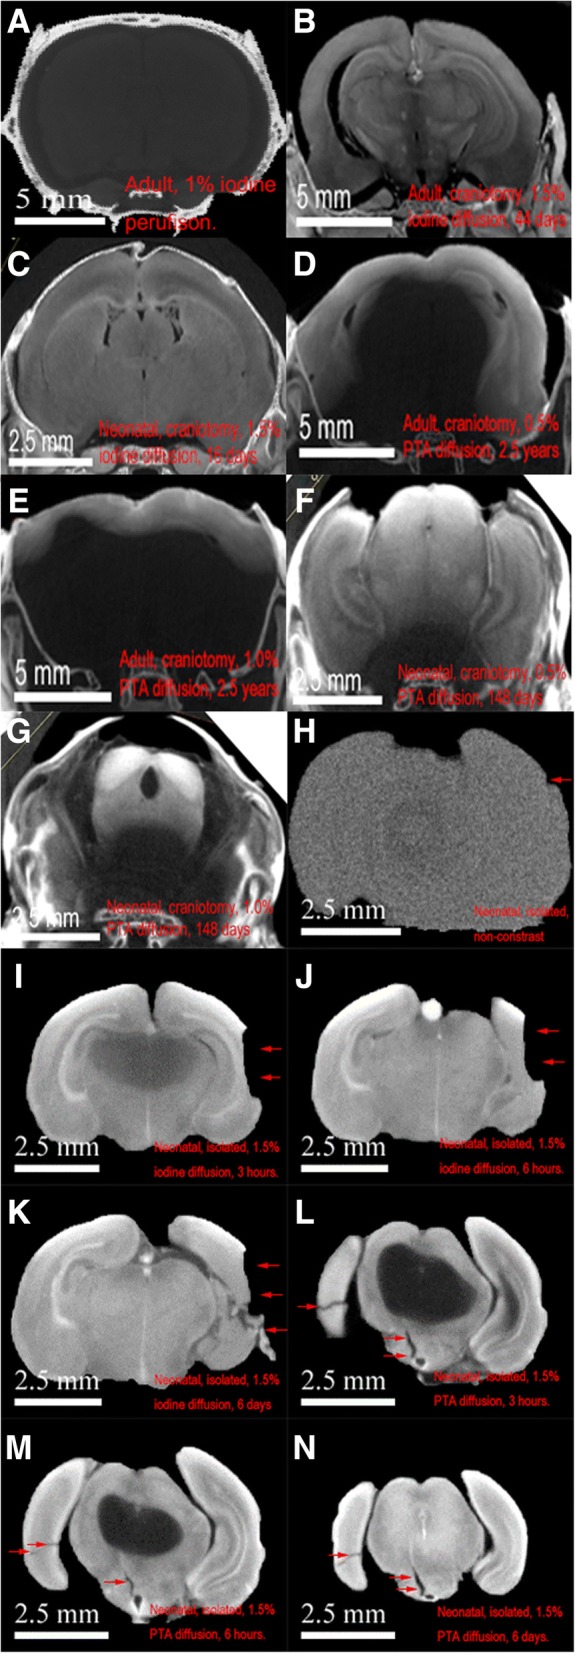
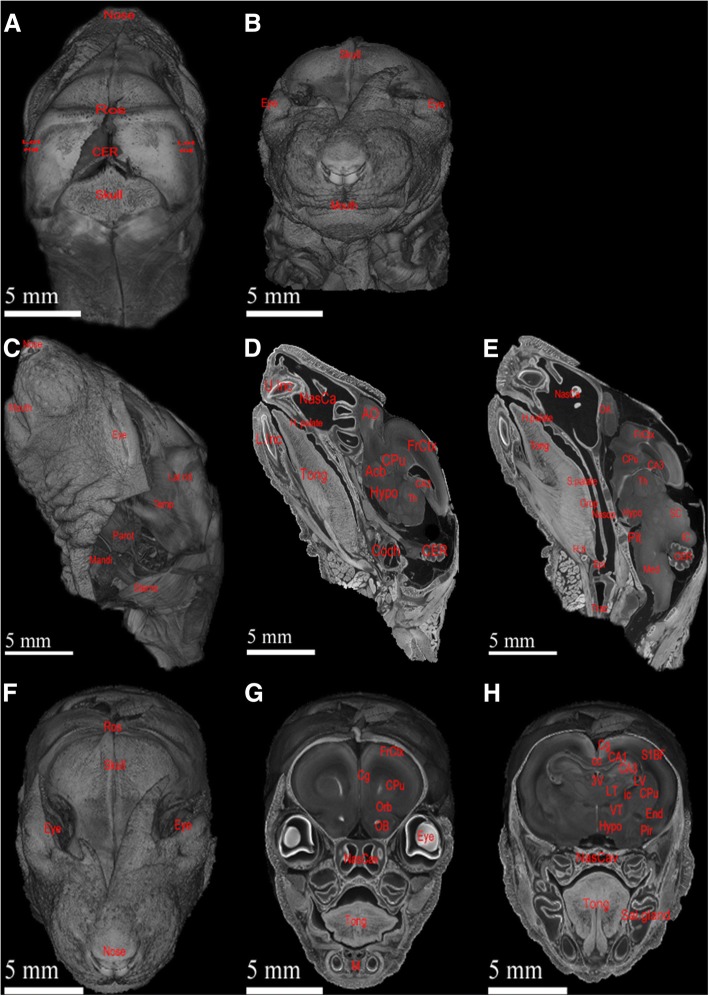
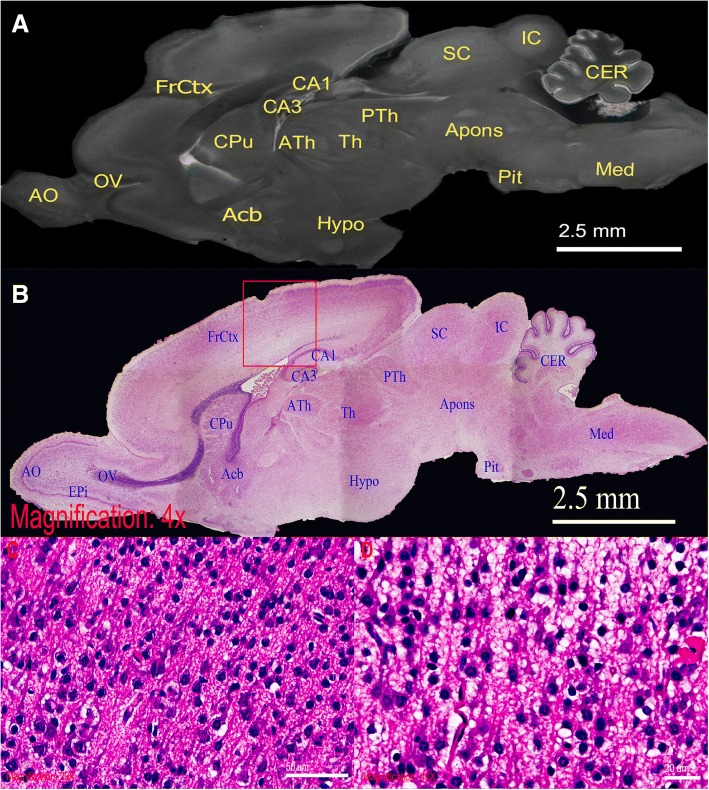
Methods: Comparisons of postnatal rat brain micro-CT scans obtained through custom-built ex vivo and commercially available in vivo micro-CT scanners were made. Subsequently, the scanned rat brains were then H&E stained for microscopy. Neuroanatomy on micro-CT scanning and 4× microscopy of rat brain were compared. Diffusion and perfusion staining using iodine or PTA were trialled on adult and neonatal encapsulated rat brains. Different combinations of stain concentration and staining time were trialled. Post-acquisition denoising with NLM filter was completed using a modern General-Purpose Graphic Processing Unit (GPGPU) and custom code for prompt processing.

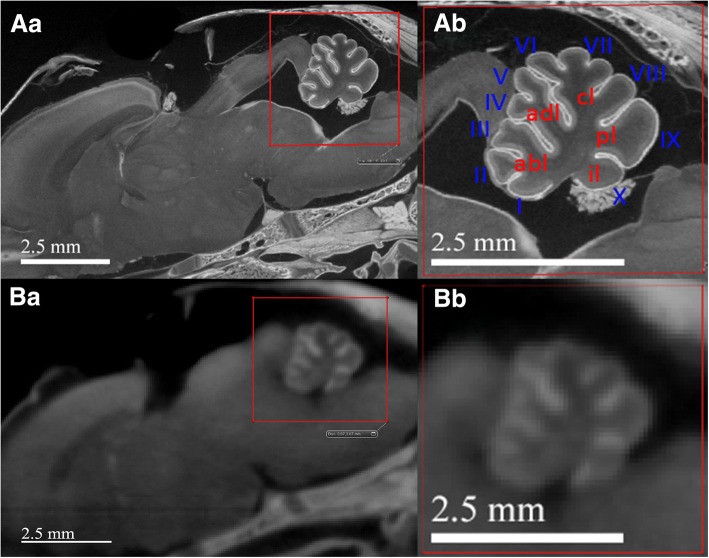
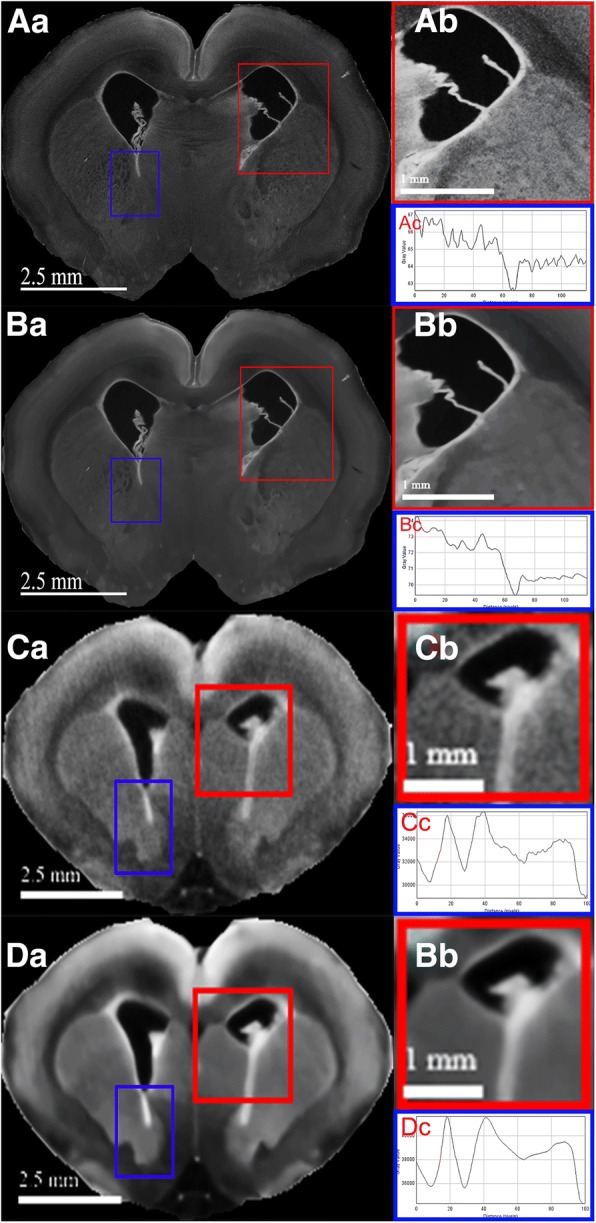
Results: Ex vivo micro-CT scans of iodine-stained postnatal rat brains yields 3D images with details comparable to 4× H&E light micrographs. Neural features shown on ex vivo micro-CT scans were significantly more distinctive than those on in vivo micro-CT scans. Both ex vivo and in vivo micro-CT scans required diffusion staining through small craniotomy. Perfusion staining is ineffective. Iodine staining was more efficient than PTA in terms of time. Consistently, enhancement made by NLM denoising on in vivo micro-CT images were more pronounced than that on ex vivo micro-CT scans due to their difference in image signal-to-noise indexes.

Conclusions: Micro-CT scanning is a powerful and versatile visualization tool available for qualitative and potential quantitative anatomical analysis. Simple diffusion staining via craniotomy with 1.5% iodine is an effective and minimal structural-invasive method for both in vivo and ex vivo micro-CT scanning for studying the microscopic morphology of neonatal and adult rat brains. Post-acquisition NLM filtering is an effective enhancement technique for in vivo micro-CT brain scans.

Keywords: Micro-CT; NLM image processing; Neuroimaging.


Conflict of interest statement

Ethics approval and consent to participate

All tissues and animals used in this study were handled with strict adherence to the requirements of the ACT Health Human Research Ethics Committee (ACTH-HREC) and Australian National University Animal Experimentation Ethics Committee (ANU-AEEC), project number A2011/67.

Consent for publication

Not applicable.

Competing interests

The authors declare that they have no competing interests.

Publisher’s Note

Springer Nature remains neutral with regard to jurisdictional claims in published maps and institutional affiliations.

Figures

Fig. 1
Fig. 1
In vivo and ex vivo micro-CT machines utilized in this study. a The Caliper Quantum FX machine representing in vivo micro-CT setup, with loading dock labelled and situated in between the rotating X-ray source and detectors; X-ray source and detector are hidden within the casing. b The custom-built ex vivo micro-CT scanner by ANU applied mathematical department. The rotational sample stage is placed in-between the adjustable X-ray source and scintillator/detector for maximal magnification
Fig. 2
Fig. 2
Successful tissue differentiation on micro-CT scanning demonstrate iodine diffusion staining technique is practical for both large (age of 25 days) and small (age of 36 h) postnatal encapsulated rat brain, Figure (ag). (a) demonstrates unsuccessful neural-tissue scanning using 1.0% iodine perfusion staining for adult rat, whereas (b) and (c) show 1.5% iodine diffusion staining yielded good neural tissue contrast with adult and neonatal rat brains after 44 and 16 days, respectively. However, the same staining techniques using 0.5 and 1.0% PTA yielded little success on adult rat brains, (d) and (e), even after 2.5 years. Similarly, (f) and (g) show incomplete tissue differentiation of neonatal rat brains despite prolonged staining of 148 days using 0.5 and 1.0% PTA staining, respectively. Because PTA staining was non-uniform, selected coronal views were chosen to illustrate regions of incomplete tissue differentiation: (ad) are anterior coronal views while (eg) are posterior coronal views. Figure (hn) illustrate iodine diffusion staining is equally effective but more efficient temporally to PTA staining for micro-CT scanning of small and isolated neural tissues. (h) shows lack of tissue contrast with no staining. (ik) illustrate progressive improvement of tissue details on micro-CT scans with 1.5% iodine staining over time: 3, 6 h, and 6 days, respectively. Similarly, (ln) show the same with 1.5% PTA staining over the same respective durations. Iodine staining was significantly faster
Fig. 3
Fig. 3
Volumetric rendering of ex vivo micro-CT scan of neonatal rat’s head enables detailed visualization and potential high-powered quantitative analysis. (a and b) illustrate respective anterior and posterior views of external features of rat’s head and neck, including mouth, nose, and muscle distributions. (c, d, and e) are respective external, parasagittal, and sagittal views of rat’s head and neck. (f, g, and h) are progressive coronal explorations of the same rat. These different views demonstrate the high-resolution power and flexibility of micro-CT scans. These exploration images show blood vessels, parotid glands, nasal anatomy, oral anatomy, and intracranial anatomy along with obvious muscular features throughout the head. Anatomical structures are labelled as follow: Acb = accumbens nucleus; AO = anterior olfactory bulb; apons = anterior pons; ATh = anterior thalamus; CA1 = CA1 field of hippocampus; CA3 = CA3 field of hippocampus; cc = corpus callosum; CER = cerebellum; Cg = cingulate gyrus; Coch = cochlea; CPu = caudate putamen; End = Endopiriform nucleus; Epi = epiglottis; EPi = external plexiform layer; FrCtx = frontal cortex; H. b = hyoid bone; H. palate = hard palate; Hypo = hypothalamus; IC = inferior colliculus; ic = internal capsule; Lat rid = lateral ridge of skull; L. Inc = lower incisor; LT = lateral thalamus; LV = lateral ventricle; M = mandible; Mandi = mandibular gland; Med = medulla; NasCa = nasal cavity; Nasop = nasopharynx; OB = olfactory bulb; Orb = orbital cortex; OV = olfactory ventricle; Parot = parotid gland; Pir = piriform cortex; Pit = pituitary gland; PTh = posterior thalamus; ROS = rostral ridge of skull; Sal. Gland = salivary gland; SC = superior colliculus; S. palate = soft palate; S1BF = Somatosensory 1 Barrel Field; Sterno = sternomastoideus; Temp = temporalis; 3 V = 3rd ventricle; Th = thalamus; Tong = tongue; Trac = trachea; U. Inc = upper incisor; VT = ventral thalamus
Fig. 4
Fig. 4
High-powered demonstration of rat brain by ex vivo micro-CT scan. Direct comparison between the sagittal section of rat brain in (a), micro-CT slice, and (b), H&E stained 4× light micrograph. Similar structural details are seen in these two imaging. (c and d) are respective 20× and 40× light micrographs of selected FrCtX region, demonstrating neuronal cell bodies. Anatomical structures of comparable visibility are labelled as follows: Acb = accumbens nucleus; AO = anterior olfactory bulb; apons = anterior pons; ATh = anterior thalamus; CA1 = CA1 field of hippocampus; CA3 = CA3 field of hippocampus; CER = cerebellum; CPu = caudate putamen; EPi = external plexiform layer; FrCtx = frontal cortex; Hypo = hypothalamus; IC = inferior colliculus; Med = medulla; OV = olfactory ventricle; Pit = pituitary gland; PTh = posterior thalamus; SC = superior colliculus; Th = thalamus
Fig. 5
Fig. 5
Direct comparison of ex vivo (spatial resolution of 10.7 μm/voxel) and in vivo (spatial resolution of 20 μm/voxel) micro-CT scans of the same 24-h-old rat’s head shows the image-quality difference between the two. (Aa) and (Ba) are sagittal illustrations of ex vivo and in vivo micro-CT scans, respectively. Gross neuroanatomy can be visualized in both scans with subtle difference appreciated by close-viewing, (Ab) and (Bb). Detailed cerebellar fissures, vermis (I–X), and lobes, can only be appreciated on ex vivo scans: abl = anterobasal lobe; adl = anterodorsal lobe; cl = central lobe; pl = posterior lobe; il = inferior lobe
Fig. 6
Fig. 6
Neuroanatomical differentiation of both ex vivo and in vivo micro-CT scan are enhanced by NLM denoising. The original (Aa) and denoised (Ba) ex vivo scans illustrate sharper periventricular edges seen in (Ba) while gross neuroanatomical details are preserved in both. The difference in image noises is more obvious when comparing the respective magnified views, (Ab) and (Bb). Similar but more prominent edge enhancements is shown by the comparison of (Ca) and (Da), original and denoised in vivo micro-CT scans, respectively. The markedly improved signal-to-noise ratio is easily appreciated in the magnified denoised (Db) from the original (Cb) views. The respective grayscale line profile of each scan revealed reductions in intensity variability in denoised group, (Bc) and (Dc), in comparison to the originals, (Ac) and (Cc)

References

    1. Weninger WJ, Geyer SH, Mohun TJ, Rasskin-Gutman D, Matsui T, Ribeiro I, et al. High-resolution episcopic microscopy: a rapid technique for high detailed 3D analysis of gene activity in the context of tissue architecture and morphology. Anat Embryol. 2006;211(3):213–221. doi: 10.1007/s00429-005-0073-x. - DOI - PubMed
    1. Sharpe J, Ahlgren U, Perry P, Hill B, Ross A, Hecksher-Sørensen J, et al. Optical projection tomography as a tool for 3D microscopy and gene expression studies. Science. 2002;296(5567):541–545. doi: 10.1126/science.1068206. - DOI - PubMed
    1. Dhenain M, Ruffins SW, Jacobs RE. Three-dimensional digital mouse atlas using high-resolution MRI. Dev Biol. 2001;232(2):458–470. doi: 10.1006/dbio.2001.0189. - DOI - PubMed
    1. Turnbull DH, Mori S. MRI in mouse developmental biology. NMR Biomed. 2007;20(3):265–274. doi: 10.1002/nbm.1146. - DOI - PMC - PubMed
    1. Metscher BD. MicroCT for developmental biology: a versatile tool for high-contrast 3D imaging at histological resolutions. Dev Dyn. 2009;238(3):632–640. doi: 10.1002/dvdy.21857. - DOI - PubMed

LinkOut - more resources