. 2019 Aug;68(8):1439-1449.
doi: 10.1136/gutjnl-2018-317155. Epub 2018 Oct 30.

Identification of TMAO-producer phenotype and host-diet-gut dysbiosis by carnitine challenge test in human and germ-free mice

Affiliations

Identification of TMAO-producer phenotype and host-diet-gut dysbiosis by carnitine challenge test in human and germ-free mice

Wei-Kai Wu et al. Gut. 2019 Aug.

Abstract

Objective: The gut microbiota-derived metabolite, trimethylamine N-oxide (TMAO) plays an important role in cardiovascular disease (CVD). The fasting plasma TMAO was shown as a prognostic indicator of CVD incident in patients and raised the interest of intervention targeting gut microbiota. Here we develop a clinically applicable method called oral carnitine challenge test (OCCT) for TMAO-related therapeutic drug efforts assessment and personalising dietary guidance.

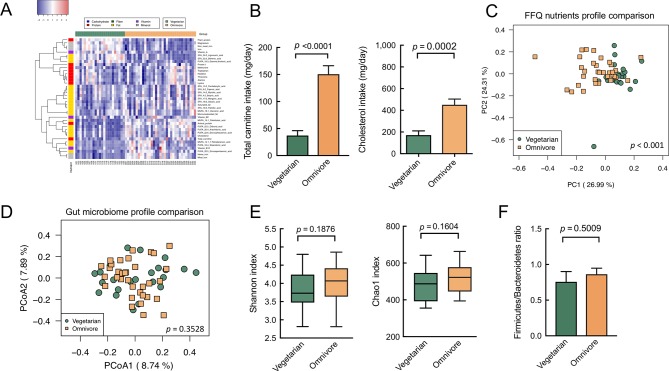
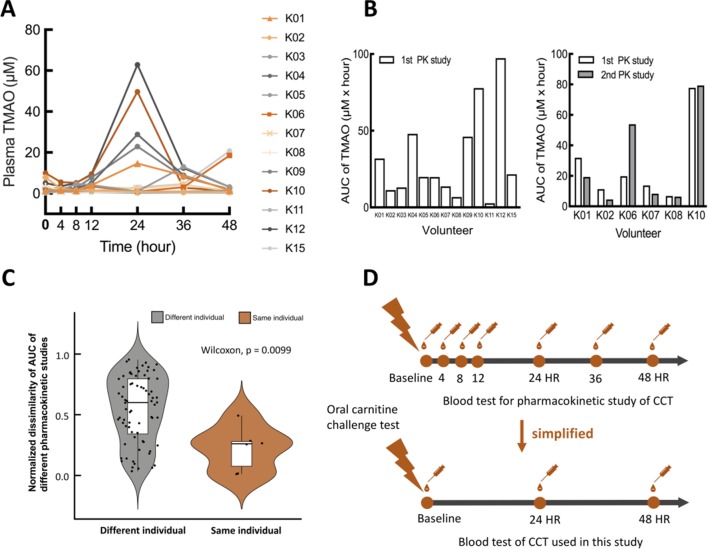
Design: A pharmacokinetic study was performed to verify the design of OCCT protocol. The OCCT was conducted in 23 vegetarians and 34 omnivores to validate gut microbiota TMAO production capacity. The OCCT survey was integrated with gut microbiome, host genotypes, dietary records and serum biochemistry. A humanised gnotobiotic mice study was performed for translational validation.

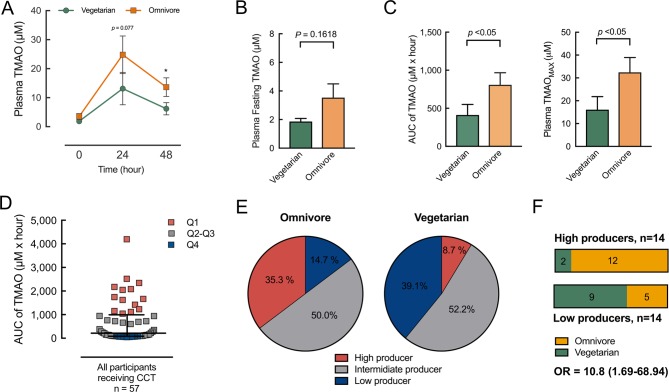
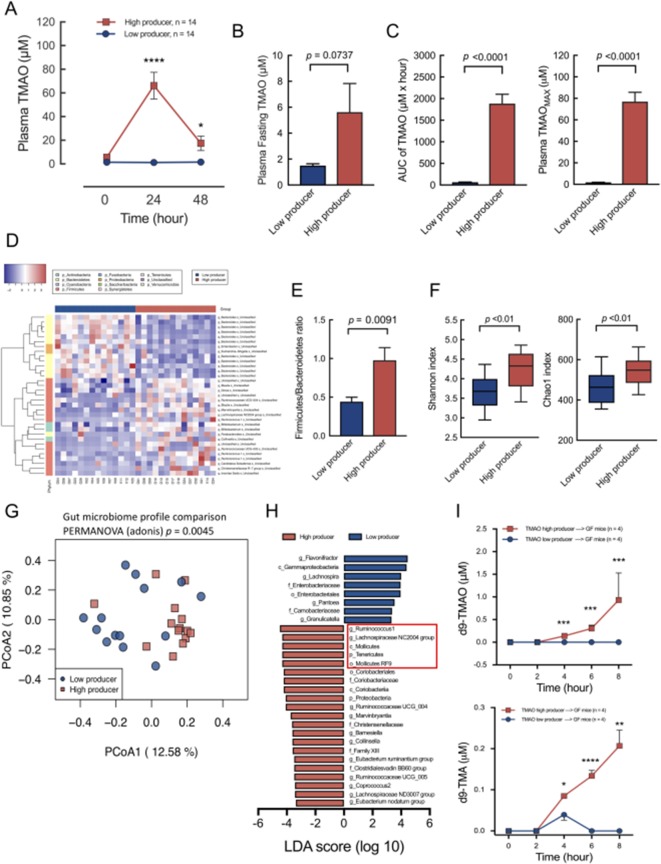
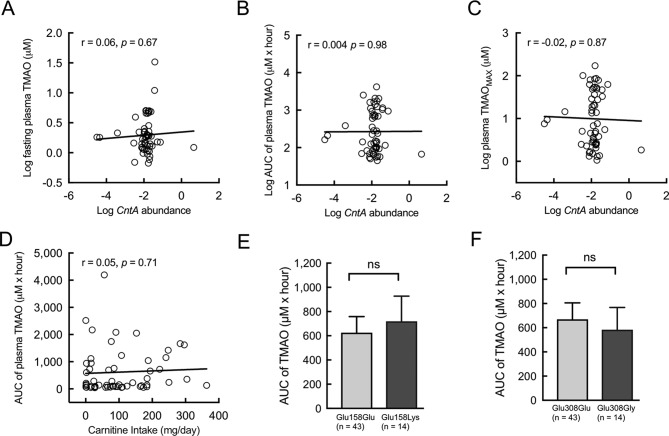
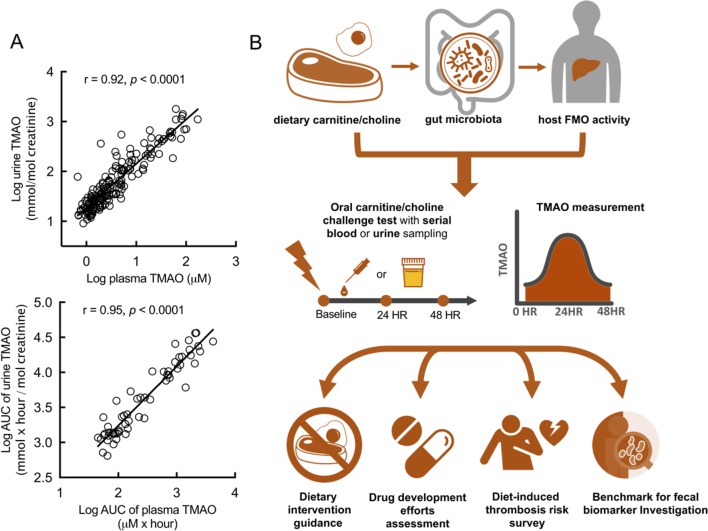
Results: The OCCT showed better efficacy than fasting plasma TMAO to identify TMAO producer phenotype. The omnivores exhibited a 10-fold higher OR to be high TMAO producer than vegetarians. The TMAO-associated taxa found by OCCT in this study were consistent with previous animal studies. The TMAO producer phenotypes were also reproduced in humanised gnotobiotic mice model. Besides, we found the faecal CntA gene was not associated with TMAO production; therefore, other key relevant microbial genes might be involved. Finally, we demonstrated the urine TMAO exhibited a strong positive correlation with plasma TMAO (r=0.92, p<0.0001) and improved the feasibility of OCCT.

Conclusion: The OCCT can be used to identify TMAO-producer phenotype of gut microbiota and may serve as a personal guidance in CVD prevention and treatment.

Trial registration number: NCT02838732; Results.

Keywords: cardiovascular disease; gut microbiota; oral carnitine challenge test; trimethylamine n-oxide.


Conflict of interest statement

Competing interests: None declared.

Figures

Figure 1
Figure 1
The divergence of dietary patterns between vegetarian and omnivore contributed no significant differences for gut microbiome composition and diversity. (A) Heatmap of dietary micronutrients in omnivores versus vegetarians (q value <0.1) with clustering nutrients colour labelled by six nutrient categories. Red=higher abundance, blue=lower abundance. (B) The carnitine and cholesterol consumption levels of vegetarians and omnivores exhibited highly significant differences. (C) The principle component analysis of FFQ nutrients data indicated significantly divergent patterns between omnivores and vegetarians (permutational multivariate analysis of variance (PERMANOVA): p<0.001). (D) Compositional profiling of gut microbiota in vegetarians and omnivores revealed no significant difference (PERMANOVA: p=0.3528) demonstrated by principle coordinate analysis calculated using Bray-Curtis distance. (E) Comparison of alpha diversity index in vegetarians versus omnivores. (F) The Firmicutes/Bacteroidetes ratio in omnivores versus vegetarians exhibited no significant difference. Data in all bar plots are expressed as mean±SEM. All statistics in bar plots and box plots were analysed by Student’s t-test. FFQ, food frequency questionnaire.
Figure 2
Figure 2
Pharmacokinetic study of oral carnitine challenge test (OCCT). (A) Thirteen volunteers were recruited for a pharmacokinetic (PK) study of the OCCT. Each participant received three tablets of GNC L-carnitine (approximately 1200 mg L-carnitine) and blood drawings at 4th hour, 8th hour, 12th hour, 24th hour, 36th hour and 48th hour. (B) The bar plots of AUC in OCCT for different volunteers and the same volunteer with different PK studies (six volunteers received the second PK study 3 months later). (C) Normalised dissimilarity of AUC of different pharmacokinetic studies in the same and different individuals (defined as |AUC1−AUC2|/[AUC1+AUC2]) AUC1: AUCs of 1st PK study; AUC2: AUCs of second PK study. These data suggested the trend of TMAO production capacity is reproducible in the same individual periodically. (D) Validation and simplification of sample collection time points for the OCCT according to the results of pharmacokinetic studies. AUC, area under the curve; CCT, carnitine challenge test; TMAO, trimethylamine N-oxide.
Figure 3
Figure 3
Omnivores and vegetarians exhibited different levels of ability to transform L-carnitine into TMAO in the body. (A) An oral carnitine challenge test (OCCT) was administered to 23 vegetarians and 34 omnivores, and plasma TMAO levels were measured at indicated times after the OCCT. The differences in plasma TMAO levels between the vegetarians and omnivores appeared at 24 hours and 48 hours compared with baseline. Data are expressed as mean±SEM; *p<0.05. (B) No significant difference of fasting plasma TMAO levels was noted between the vegetarian and omnivore groups. (C) The AUC values and maximum values of the carnitine challenge test for the omnivores were both significantly higher than for the vegetarians. (D) The population was grouped into four quartiles according to the AUC values of the OCCT. The Q4 population was defined as high TMAO producers, the Q1 as low producers and Q2Q3 as intermediate producers. (E) A percentage of 35.3 of the omnivores were grouped as high TMAO producers compared with 8.7% of the vegetarians. A percentage of 14.7 of the omnivores were grouped as low producers compared with 39.1% of the vegetarians. (F) Among the high producers, 12/14 (86%) were omnivores, whereas among the low producers, 5/14 (36%) were omnivores. The ORs of omnivores versus vegetarians as being high TMAO producers is 10.8 (95% CI 1.69 to 68.94). Data in all bar plots are expressed as mean±SEM. Plasma TMAO levels at indicated times in OCCT and plasma fasting TMAO data were analysed by Student’s t-test. AUC of TMAO and TMAOMAX in OCCT were analysed by Mann-Whitney U test. AUC, area under the curve; TMAO, trimethylamine N-oxide.
Figure 4
Figure 4
The functional phenotypes grouped by oral carnitine challenge test (OCCT) were significantly associated with the differences of gut microbiome composition, diversity, features and functions. (A) The high TMAO producers and low producers corresponded with distinct curves for the OCCT. Data are expressed as mean±SEM. (B) The difference in plasma fasting TMAO levels between the high producers and low producers was moderately significant. (C) The differences in AUC values and maximum OCCT values were highly distinct. (D) Heatmap demonstration of hierarchical clustering correlating levels of bacterial taxa significantly differentiated (p<0.01) between the high and low TMAO producers. The heatmap displayed relatively higher taxa in Firmicutes phylum (pink) in high TMAO producers compared with low producers, and opposite results were indicated for the Bacteroidetes phylum (yellowish). (E) The Firmicutes/Bacteroidetes ratio between low producers versus high producers was significantly different. (F) The alpha diversity of Shannon index and Chao1 index between the high TMAO producers and low producers was also significantly different. (G) Principle coordinate analysis of the gut microbiome profiles of the TMAO high producers versus low producers indicated a significant difference. (H) The characteristic phylogenetic taxa in the TMAO high producers versus low producers ranked by the LDA score exhibited similarities to taxa (marked in the red frame) detected in previous well-controlled mouse studies. (I) Eight 9-week-old male germ-free mice (n=4 in each group) received faecal microbiota transplantation from a high-TMAO-producer or low-TMAO-producer donor as a humanised gnotobiotic mice model. The mice were placed with carnitine supplement diet (1.3% in water) and received a d9-carnitine challenge test through oral gavage. The phenotypes of TMAO-producing ability of donors were significantly reproduced in the mice. Data are expressed as mean±SEM. Plasma TMAO levels at indicated times in OCCT, plasma fasting TMAO, Firmicutes/Bacteroidetes ratio, Shannon and Chao1 index, plasma d9-TMAO and d9-TMA data were analysed by Student’s t-test. AUC of TMAO and TMAOMAX in OCCT were analysed by Mann-Whitney U test; *p<0.05, **p<0.01, ***p<0.001, ****p<0.0001. AUC, area under the curve; LDA, linear discriminant analysis; TMAO, trimethylamine N-oxide.
Figure 5
Figure 5
Carnitine intake amount, faecal CntA abundances and host FMO3 genotypes correlated unfavourably with TMAO-producing ability in the human body. (A) The CntA abundances (% of community) exhibited a poor correlation to fasting plasma TMAO, (B and C) AUC and maximum values of plasma TMAO of OCCT. (D) Carnitine intake amount also poorly correlated with the AUC of plasma TMAO. (E and F) Two common host flavin mono-oxygenase (FMO) single-nucleotide polymorphism, FMO3/Lys158 and FMO3/Gly308 mutant alleles, were detected in the study population, and no difference of TMAO production was exhibited between mutant and wild genotypes. Data in bar plots are expressed as mean±SEM. Pearson’s correlation was used to calculate association between two variables. Student’s t-test was used for two-group comparison. AUC, area under the curve; OOCT, oral carnitine challenge test; TMAO, trimethylamine N-oxide.
Figure 6
Figure 6
Urine TMAO levels exhibited strong correlation with plasma TMAO levels and may serve a substitute specimen for an oral carnitine challenge test (OOCT). (A) The logarithmic TMAO values of 171 plasma samples strongly correlated with the corresponding TMAO values of urine samples from the same subject and sampling times. The logarithmic AUC values of plasma TMAO in 57 participants strongly correlated with the AUC values of urine TMAO in the same OCCT. (B) The OCCT may reflect the results from crosstalk between diet, gut microbiota and the host and could be used to measure TMAO-producing ability individually. The OCCT may serve as a personalised dietary guidance or a diet-induced thrombotic risk surveillance. It could also be used to assess therapeutic efficacy of new drug development or may be served as a benchmark for investigation of TMAO-relevant biomarkers in the faeces. Pearson’s correlation was used to calculate association between two variables. AUC, area under the curve; TMAO, trimethylamine N-oxide.

Comment in

Similar articles

Cited by

References

    1. Wang Z, Klipfell E, Bennett BJ, et al. . Gut flora metabolism of phosphatidylcholine promotes cardiovascular disease. Nature 2011;472:57–63. 10.1038/nature09922 - DOI - PMC - PubMed
    1. Tang WH, Wang Z, Levison BS, et al. . Intestinal microbial metabolism of phosphatidylcholine and cardiovascular risk. N Engl J Med 2013;368:1575–84. 10.1056/NEJMoa1109400 - DOI - PMC - PubMed
    1. Tang WH, Hazen SL. The contributory role of gut microbiota in cardiovascular disease. J Clin Invest 2014;124:4204–11. 10.1172/JCI72331 - DOI - PMC - PubMed
    1. Tilg H. A Gut Feeling about Thrombosis. N Engl J Med 2016;374:2494–6. 10.1056/NEJMcibr1604458 - DOI - PubMed
    1. Tremaroli V, Bäckhed F. Functional interactions between the gut microbiota and host metabolism. Nature 2012;489:242–9. 10.1038/nature11552 - DOI - PubMed

Publication types

Associated data