. 2019 Jan 7;218(1):190-205.
doi: 10.1083/jcb.201805047. Epub 2018 Oct 30.

CLASP stabilization of plus ends created by severing promotes microtubule creation and reorientation

Affiliations

CLASP stabilization of plus ends created by severing promotes microtubule creation and reorientation

Jelmer J Lindeboom et al. J Cell Biol. .

Abstract

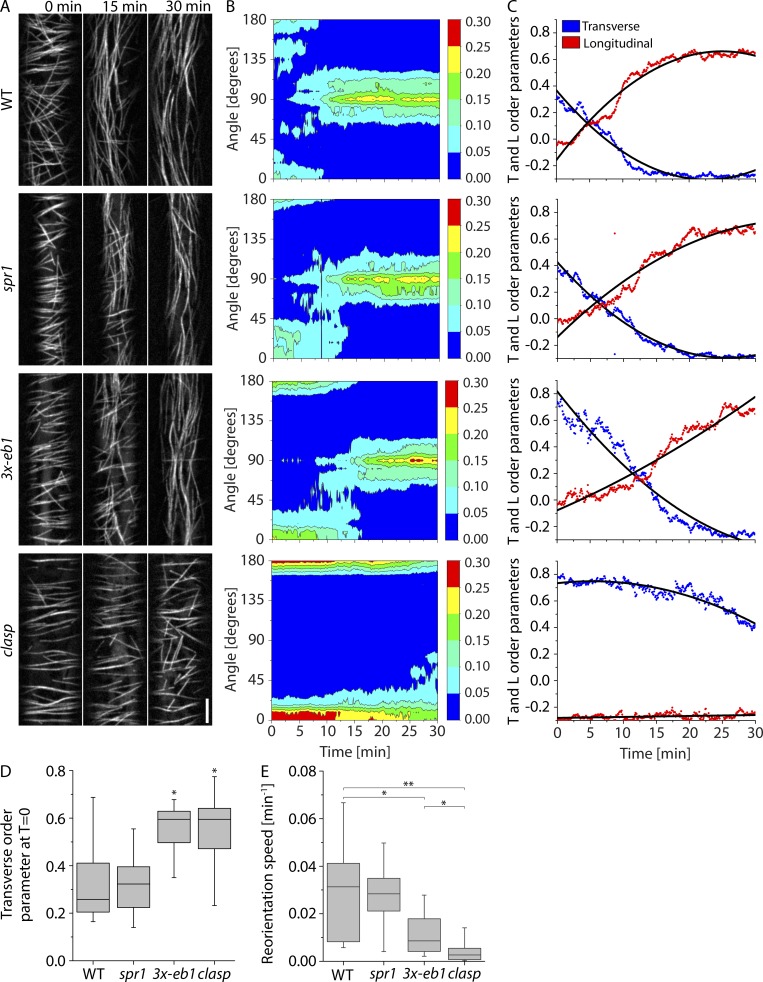
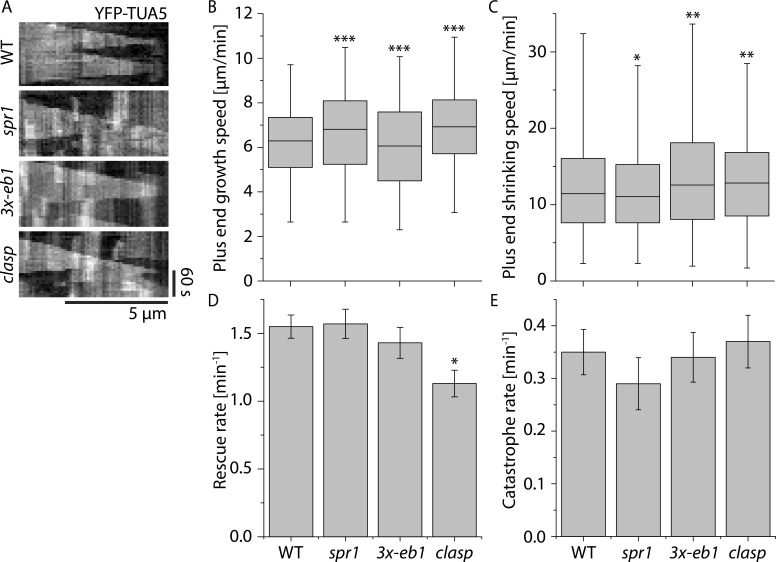
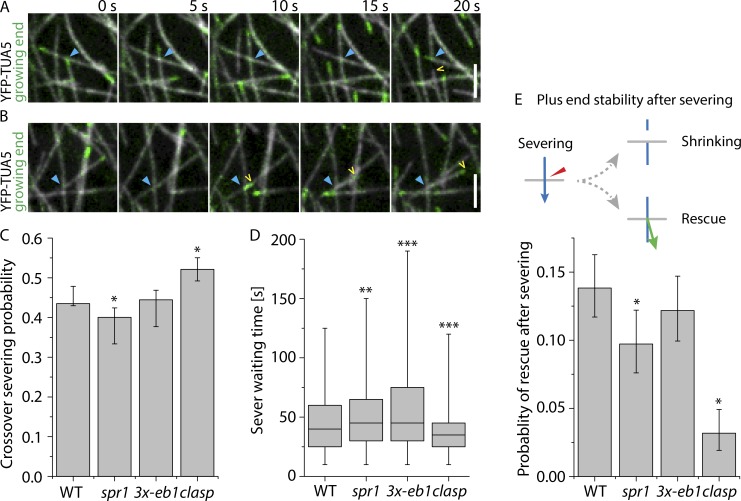
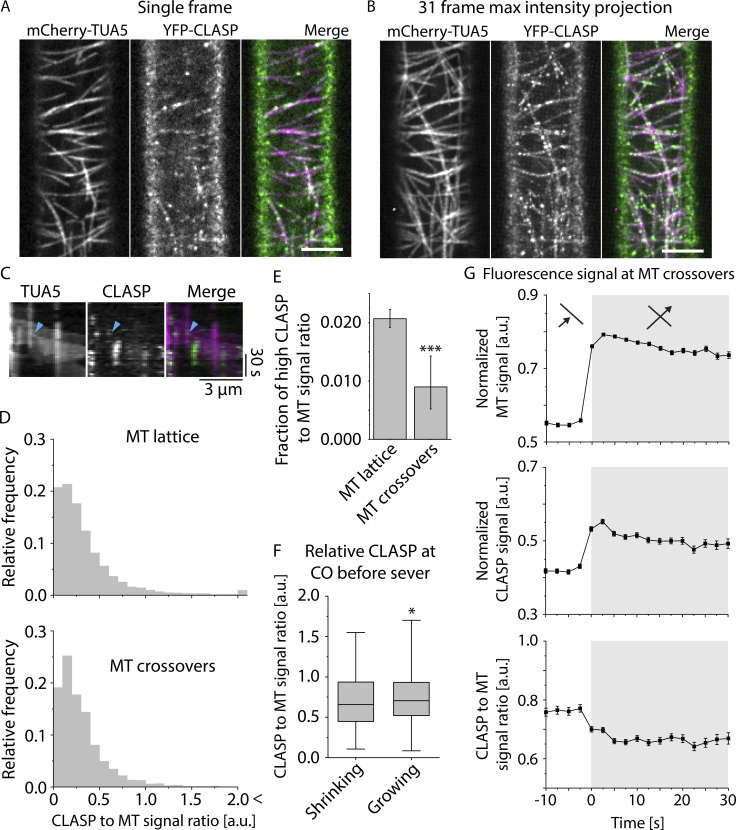
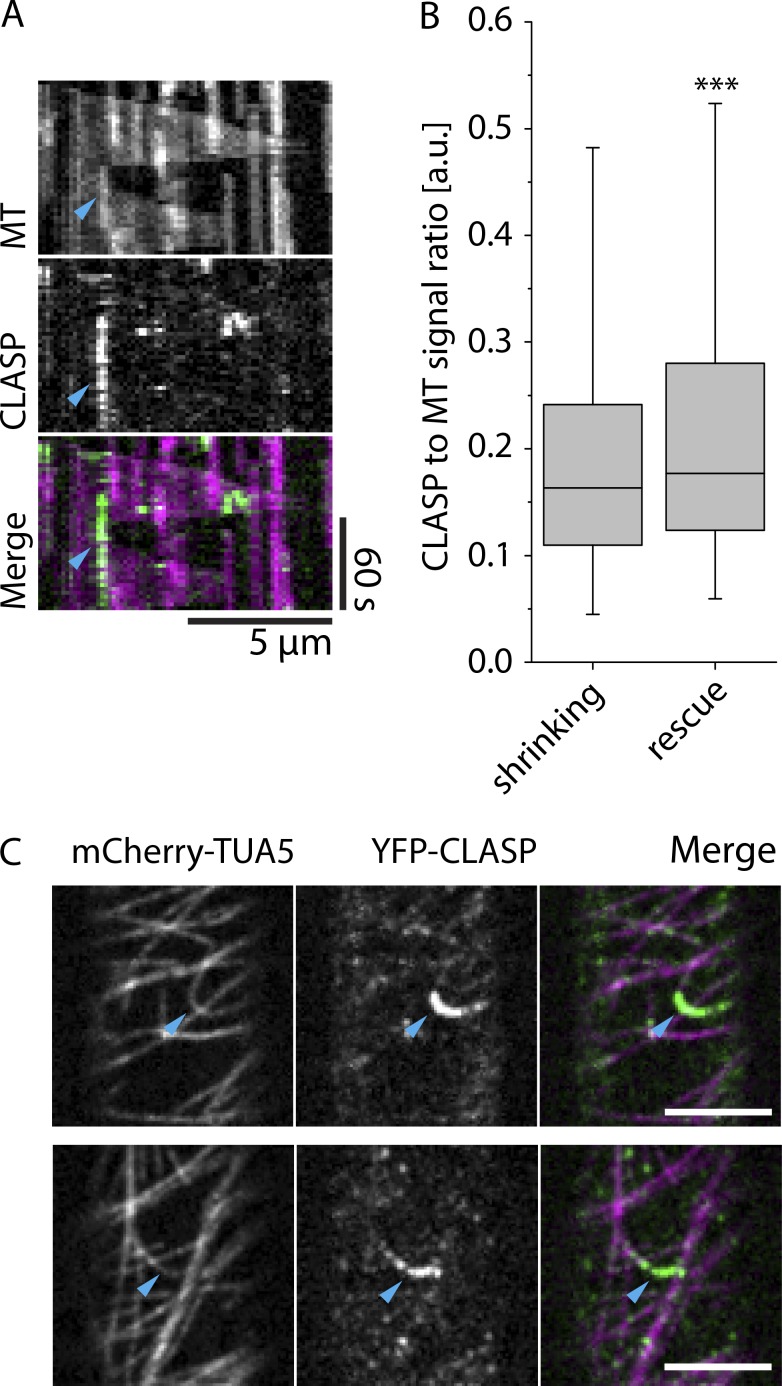
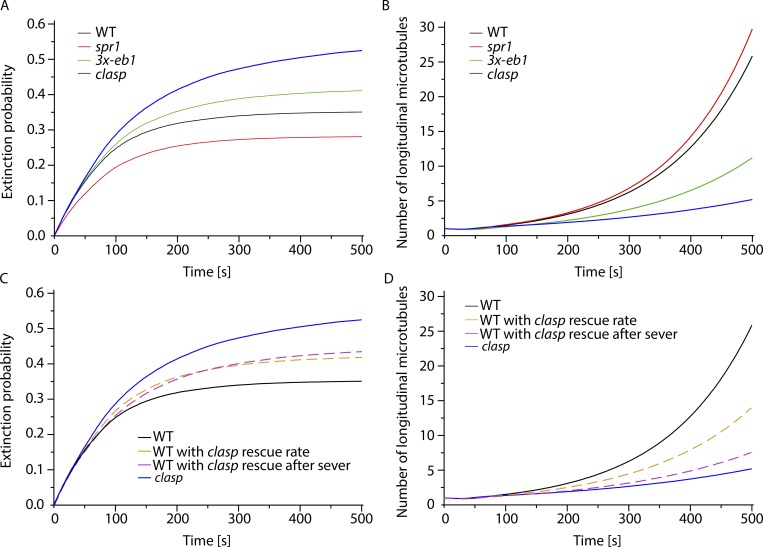
Central to the building and reorganizing cytoskeletal arrays is creation of new polymers. Although nucleation has been the major focus of study for microtubule generation, severing has been proposed as an alternative mechanism to create new polymers, a mechanism recently shown to drive the reorientation of cortical arrays of higher plants in response to blue light perception. Severing produces new plus ends behind the stabilizing GTP-cap. An important and unanswered question is how these ends are stabilized in vivo to promote net microtubule generation. Here we identify the conserved protein CLASP as a potent stabilizer of new plus ends created by katanin severing in plant cells. Clasp mutants are defective in cortical array reorientation. In these mutants, both rescue of shrinking plus ends and the stabilization of plus ends immediately after severing are reduced. Computational modeling reveals that it is the specific stabilization of severed ends that best explains CLASP's function in promoting microtubule amplification by severing and array reorientation.


Figures

Figure 1.
Figure 1.
Microtubule reorientation in +TIP mutants. (A) Panels from confocal image time series of dark-grown hypocotyl cells expressing YFP-TUA5 in WT, spr1, 3- eb1, and clasp mutant backgrounds at 0, 15, and 30 min after induction of reorientation by blue light. See Video 1. Scale bar is 5 µm. (B) Representative contour plots of MT orientation over time corresponding to the videos shown in A. The color scale represents fraction of microtubules. (C) Longitudinal and transverse order parameters during MT reorientation for the videos shown in A. Black lines show quadratic fit. (D) Transverse order parameter at T = 0 for cortical microtubules imaged in WT, spr1, 3x-eb1, and clasp seedlings. n = 8, 9, 9, and 9 cells, respectively. A Kruskal–Wallis test showed significant differences among the genotypes (P < 0.01). Asterisks represent significant difference from WT by Mann–Whitney U test (P < 0.05). (E) Longitudinal reorientation speed (Lindeboom et al., 2013b) of imaged microtubule arrays in etiolated hypocotyl cells expressing YFP-TUA5 in WT, spr1, 3x-eb1, and clasp seedlings. A Kruskal–Wallis test showed significant differences for reorientation speed distributions among the genotypes (P < 0.01). n = 8, 9, 9, and 9 cells, respectively. Asterisks represent significant difference from WT in Mann–Whitney U test (*, P < 0.05; **, P < 0.01; ***, P < 0.001). Boxplots show the 25th and 75th percentile as box edges, the line in the box indicates median value, and the whiskers show the 2.5th and 97.5th percentile.
Figure 2.
Figure 2.
Microtubule plus end dynamics in +TIP mutants. (A) Kymographs of microtubules during early stages of cortical array reorientation induced by blue light in WT, spr1, 3x-eb1, and clasp seedlings expressing YFP-TUA5. (B and C) Boxplot of microtubule plus end growth speeds (B) and plus end shrinkage speeds (C) in n = 2,148, 1,405, 1,837, and 1,516 segments measured in WT, spr1, 3x-eb1, and clasp seedlings, respectively. Boxplots show the 25th and 75th percentile as box edges, the line in the box indicates median value, and the whiskers show the 2.5th and 97.5th percentile. Asterisks indicate a significant difference from WT. (D) Microtubule rescue rates. n = 213, 135, 110, and 116 rescues in WT, spr1, 3x-eb1, and clasp mutant backgrounds, respectively. Error bars represent SEM. Asterisks indicate a significant difference by rate ratio test. (E) Microtubule catastrophe rates. n = 190, 119, 155, and 148 rescues in WT, spr1, 3x-eb1, and clasp mutant backgrounds, respectively. Error bars represent SEM. Asterisks indicate significant difference compared with WT by rate ratio test. *, P < 0.05; **, P < 0.01; ***, P < 0.001. Data for all measurements are from six cells in six plants for each genotype.
Figure 3.
Figure 3.
Analysis of microtubule crossovers in +TIP mutants. (A and B) Examples of crossovers (blue arrowhead) where severing occurs, followed by depolymerization (A; see Video 2) or polymerization (B; see Video 3) of the new plus end (yellow arrowhead) in a WT cell expressing YFP-TUA5. Scale bars are 3 µm. (C) Severing probability per crossover in cells expressing YPF-TUA5 in WT, spr1, 3x-eb1, and clasp backgrounds (n = 2,027, 1,696, 1,718, and 1,147 crossovers in six cells, respectively). Error bars show 95% confidence internals. Asterisks indicate a significant difference from WT by Fisher’s exact test. (D) Waiting times from the observed moment of crossover generation until observed evidence for MT severing in WT, spr1, 3x-eb1, and clasp backgrounds (n = 2,027, 1,696, 1,718, and 1,147 crossovers in six cells, respectively). Boxplots show the 25th and 75th percentile as box edges, the line in the box indicates median value, and the whiskers show the 2.5th and 97.5th percentile. A Kruskal–Wallis test showed significant differences in sever waiting times among the genotypes (P < 0.001). Asterisks indicate significant difference from WT by Mann–Whitney U test. (E) Probability of new plus ends created by severing at crossovers being initially observed in a growing state (n = 882, 679, 764, and 598 crossover severing events in WT, spr1, 3x-eb1, and clasp backgrounds, respectively). Error bars show 95% confidence intervals. Asterisks indicate a significant difference from WT by Fisher’s exact test. *, P < 0.05; **, P < 0.01; ***, P < 0.001.
Figure 4.
Figure 4.
CLASP signal intensities at crossover sites. (A and B) Example of MT and CLASP signal distribution in a 3-d-old dark-grown hypocotyl epidermal cell of a clasp mutant that is complemented by a YFP-CLASP construct and in addition expresses mCherry-TUA5 (see Video 4). A single frame is shown in A, and B shows a maximum-intensity projection of the first 31 frames at a 5-s time interval. Scale bar is 5 µm. (C) Kymograph of MT plus end stabilization and regrowth after severing at a microtubule crossover, showing both MT and CLASP signal (see Video 6). Cyan arrowhead indicates the point of stabilization and regrowth of the new plus end as observed in the MT channel. (D) Histograms of the distribution of CLASP-to-MT signal ratio along the microtubules, excluding crossover sites. The top panel shows the distribution for free MT lattice, and the bottom panel shows the distribution exclusively for MT crossovers (n = 33,742 and n = 1,893 pixels for MT lattice and MT crossovers, respectively, with n = 396 crossovers in six cells). The distribution of CLASP-to-MT signal ratio for the crossovers is significantly different from that on the free MT lattice (P < 0.05, Mann–Whitney U test, one-tailed), with the crossover distribution depleted in the high-ratio values measured along the free lattice. (E) Bar graph depicting the frequency of high CLASP-to-MT signal ratio (>1.5) at MT lattice versus MT crossovers (n = 33,742 and n = 1,893 pixels for MT lattice and MT crossovers, respectively). The frequency of high CLASP-to-MT signal ratio is significantly lower at MT crossovers compared with MT lattice (***, P < 0.001, Fisher’s exact test, one-tailed; error bars show 95% confidence interval). (F) Boxplot of CLASP-to-MT signal intensity ratios at microtubule crossovers in the frame just before the lagging plus end was observed either growing (n = 100) or shrinking (n = 551). MTs observed growing immediately after severing showed modest but significantly higher CLASP-to-MT signal ratios than those observed shrinking after severing (*, P < 0.05, Mann–Whitney U test, one-tailed). Boxplots show the 25th and 75th percentile as box edges, the line in the box indicates median value, and the whiskers show the 2.5th and 97.5th percentile. (G) MT and CLASP signal intensities during crossover formation. The top panel shows the relative MT signal intensity, the middle panel the relative CLASP signal intensity, and the bottom panel shows the ratio of CLASP-to-MT signal intensity (n = 1,532 crossovers in six cells in six plants). The white background indicates the time before the crossovers are formed, and the gray background indicates the time at which the crossover is formed.
Figure 5.
Figure 5.
CLASP signal and microtubule rescue. (A) Kymograph of a MT rescue event coinciding with high CLASP signal intensity. Cyan arrowhead indicates the point of MT rescue. (B) Boxplot of CLASP-to-MT signal intensity ratios for microtubules that continue shrinking and microtubules that get rescued. Boxplots show the 25th and 75th percentile as box edges, the line in the box indicates median value, and the whiskers show the 2.5th and 97.5th percentile. Microtubules were observed shrinking in 2,716 frames, and we observed rescue 301 times. CLASP-to-MT signal intensity ratios were shown to be significantly higher in locations where the rescues occurred by Mann–Whitney U test; ***, P < 0.001. (C) Examples of high CLASP signal intensity on highly curved microtubule in 3-d-old dark-grown hypocotyl epidermal cell expressing YFP-CLASP and mCherry-TUA5 (see Video 5). Scale bars are 5 µm.
Figure 6.
Figure 6.
Simulation of microtubule amplification driven by severing. (A) Time evolution of the fraction of extinctions in WT, spr1, 3x-eb1, and clasp mutants. Extinctions are more likely in less stable mutants, i.e., mutants that are less deep into the unbounded growth regimen. (B) Time evolution of the average number of microtubules during the amplification process shows that a lower probability of rescue after severing and a less deep unbounded growth regimen in 3x-eb1 and clasp mutants result in a slower amplification compared with spr1 and WT. (C and D) Time evolution of the fraction of extinctions in WT with clasp intrinsic rescue rate, and WT with clasp rescue after severing probability in silico mutants, shows that even if the two reduced rescue parameters have a similar effect on the extinction probability (C), the probability of rescue after severing Ps,+ has a greater impact on the amplification process (D). Indeed WT microtubules with clasp Ps,+ perform an amplification that almost completely reproduces the clasp results (dashed purple curve).

Comment in

References

    1. Abramowitz M., and Stegun I.A.. 1965. Handbook of mathematical functions with formulas, graphs, and mathematical tables. Dover Publications, New York. 1 pp.
    1. Akhmanova A., and Steinmetz M.O.. 2015. Control of microtubule organization and dynamics: two ends in the limelight. Nat. Rev. Mol. Cell Biol. 16:711–726. 10.1038/nrm4084 - DOI - PubMed
    1. Akhmanova A., Hoogenraad C.C., Drabek K., Stepanova T., Dortland B., Verkerk T., Vermeulen W., Burgering B.M., De Zeeuw C.I., Grosveld F., and Galjart N.. 2001. Clasps are CLIP-115 and -170 associating proteins involved in the regional regulation of microtubule dynamics in motile fibroblasts. Cell. 104:923–935. 10.1016/S0092-8674(01)00288-4 - DOI - PubMed
    1. Al-Bassam J., Kim H., Brouhard G., van Oijen A., Harrison S.C., and Chang F.. 2010. CLASP promotes microtubule rescue by recruiting tubulin dimers to the microtubule. Dev. Cell. 19:245–258. 10.1016/j.devcel.2010.07.016 - DOI - PMC - PubMed
    1. Alonso J.M., Stepanova A.N., Leisse T.J., Kim C.J., Chen H., Shinn P., Stevenson D.K., Zimmerman J., Barajas P., Cheuk R., et al. . 2003. Genome-wide insertional mutagenesis of Arabidopsis thaliana. Science. 301:653–657. 10.1126/science.1086391 - DOI - PubMed

Publication types

MeSH terms

LinkOut - more resources