

doi: 10.1038/s41592-018-0173-1.
Epub 2018 Oct 30.
A fully automatic method yielding initial models from high-resolution cryo-electron microscopy maps
Affiliations
- PMID: 30377346
- PMCID: PMC6214191
- DOI: 10.1038/s41592-018-0173-1
Item in Clipboard
A fully automatic method yielding initial models from high-resolution cryo-electron microscopy maps
Nat Methods.
2018 Nov.
Abstract
We report a fully automated procedure for the optimization and interpretation of reconstructions from cryo-electron microscopy (cryo-EM) data, available in Phenix as phenix.map_to_model. We applied our approach to 476 datasets with resolution of 4.5 Å or better, including reconstructions of 47 ribosomes and 32 other protein-RNA complexes. The median fraction of residues in the deposited structures reproduced automatically was 71% for reconstructions determined at resolutions of 3 Å or better and 47% for those at resolutions worse than 3 Å.
Conflict of interest statement
Competing Interests. The authors declare no competing financial interests.
Figures
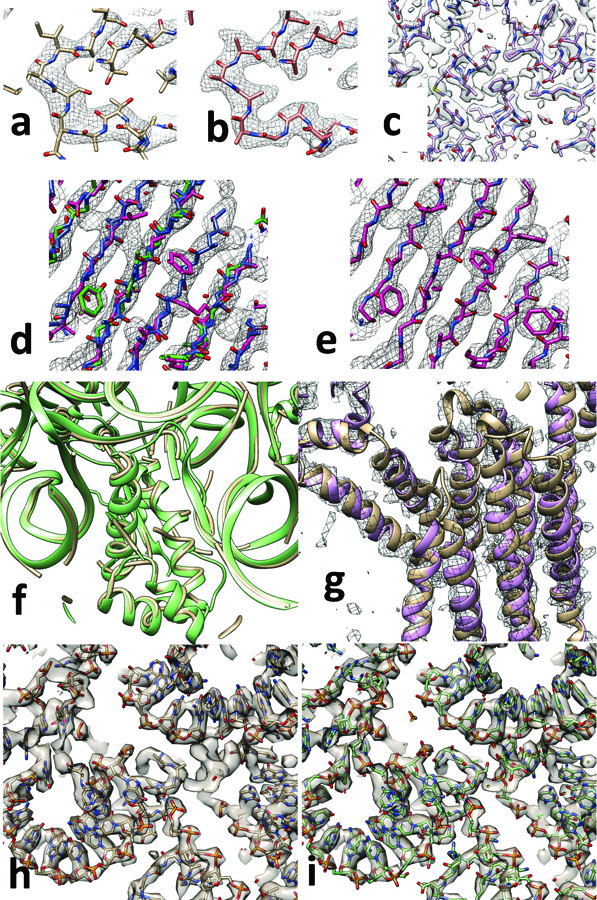
Automated interpretation of cryo-EM maps. A. Section through deposited cryo-EM reconstruction and deposited interpretation for lactate dehydrogenase (EMDB entry 8191). B. Automatically sharpened version of map in A with automatically generated model (PDB entry 5k0z). C. Automatic interpretation of β-galactosidase at a resolution of 2.2 Å. D. Automatically sharpened version of map for EMDB entry 6630 (glutamate dehydrogenase) with three independent automatically-generated interpretations (using chain-tracing, green model, feature-based helix and strand identification, blue model, and pattern-based secondary structure identification with fragment-based extension, magenta model). E. Composite model derived from the three models in D. F. Automatically interpreted reconstruction of the Mycobacterium smegmatis ribosome (yellow tubes) compared with deposited model (green ribbons). G. Automatically generated model of the ERAD channel Hrd1 (purple ribbons) compared with deposited model (brown ribbons). H. detail of automatically-built Mycobacterium smegmatis ribosome, and I, corresponding portion of deposited model. See text for details. Graphics created with Chimera.
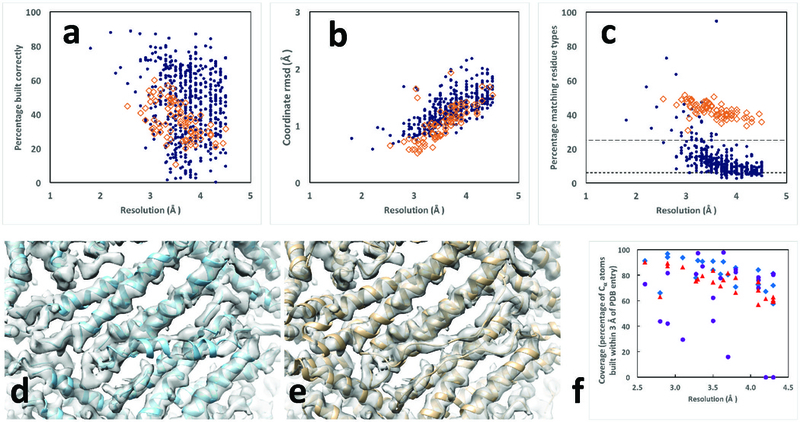
Residues in deposited models reproduced by automated analysis of cryo-EM reconstructions. Protein chains are indicated by blue dots and RNA chains are indicated by open brown diamonds. Residues are considered matched if Cα atom or P atom coordinates match within 3 Å (see Methods). Rms coordinate differences are assessed for all matched residues. A. Fraction of residues in deposited structure reproduced by automated analysis. Blue dots are protein chains and orange squares are RNA chains in panels A-C. B. Rms coordinate differences between matched residues in deposited structure and automated analysis. C. Fraction of residues in automated analysis matching a residue in the deposited model that also share the residue type of the matching residue in the deposited structure. The expected fraction matching based on random sequence assignment is roughly 6% for protein with 20 amino acids with frequencies in eukaryotes and roughly 25% for RNA with 4 bases and similar frequencies, illustrated by the horizontal lines in Fig. 2C. D and E, automatically generated and deposited models of horse spleen apoferritin (EMDB entry 2788 and PDB entry 4v1w). F. Comparison of fraction of deposited models reproduced by MAINMAST (blue diamonds), de novo Rosetta modeling (purple circles), and using the automated procedure described here (red triangles), all based on maps cut out from deposited maps based on a single chain of the deposited model as described. Graphics created with Chimera.
Similar articles
-
Protein identification from electron cryomicroscopy maps by automated model building and side-chain matching.Acta Crystallogr D Struct Biol. 2021 Apr 1;77(Pt 4):457-462. doi: 10.1107/S2059798321001765. Epub 2021 Mar 30. Acta Crystallogr D Struct Biol. 2021. PMID: 33825706 Free PMC article.
-
Ribosome dynamics: insights from atomic structure modeling into cryo-electron microscopy maps.Annu Rev Biophys Biomol Struct. 2006;35:299-317. doi: 10.1146/annurev.biophys.35.040405.101950. Annu Rev Biophys Biomol Struct. 2006. PMID: 16689638 Review.
-
Cryo_fit: Democratization of flexible fitting for cryo-EM.J Struct Biol. 2019 Oct 1;208(1):1-6. doi: 10.1016/j.jsb.2019.05.012. Epub 2019 Jul 3. J Struct Biol. 2019. PMID: 31279069 Free PMC article.
-
Multiparticle cryo-EM of ribosomes.Methods Enzymol. 2010;483:161-77. doi: 10.1016/S0076-6879(10)83008-3. Methods Enzymol. 2010. PMID: 20888474
-
Time-resolved cryo-electron microscopy: Recent progress.J Struct Biol. 2017 Dec;200(3):303-306. doi: 10.1016/j.jsb.2017.06.005. Epub 2017 Jun 16. J Struct Biol. 2017. PMID: 28625887 Free PMC article. Review.
Cited by
-
Macromolecular structure determination using X-rays, neutrons and electrons: recent developments in Phenix.Acta Crystallogr D Struct Biol. 2019 Oct 1;75(Pt 10):861-877. doi: 10.1107/S2059798319011471. Epub 2019 Oct 2. Acta Crystallogr D Struct Biol. 2019. PMID: 31588918 Free PMC article.
-
Challenges and opportunities in cryo-EM single-particle analysis.J Biol Chem. 2019 Mar 29;294(13):5181-5197. doi: 10.1074/jbc.REV118.005602. Epub 2019 Feb 25. J Biol Chem. 2019. PMID: 30804214 Free PMC article. Review.
-
Integrated Protocol of Protein Structure Modeling for Cryo-EM with Deep Learning and Structure Prediction.bioRxiv [Preprint]. 2023 Nov 21:2023.10.19.563151. doi: 10.1101/2023.10.19.563151. bioRxiv. 2023. Update in: Nat Methods. 2024 Jan;21(1):122-131. doi: 10.1038/s41592-023-02099-0. PMID: 37904978 Free PMC article. Updated. Preprint.
-
MarkovFit: Structure Fitting for Protein Complexes in Electron Microscopy Maps Using Markov Random Field.Front Mol Biosci. 2022 Jul 25;9:935411. doi: 10.3389/fmolb.2022.935411. eCollection 2022. Front Mol Biosci. 2022. PMID: 35959463 Free PMC article.
-
Sequential immunization of macaques elicits heterologous neutralizing antibodies targeting the V3-glycan patch of HIV-1 Env.Sci Transl Med. 2021 Nov 24;13(621):eabk1533. doi: 10.1126/scitranslmed.abk1533. Epub 2021 Nov 24. Sci Transl Med. 2021. PMID: 34818054 Free PMC article.
References
Publication types
MeSH terms
Substances
Grants and funding
LinkOut - more resources
Full Text Sources
Other Literature Sources
